Every Dubai community pitch collapses to one number, usually a yield or a "growth story," and that number is almost always true and almost always incomplete. Propick's own Dubai Land Department data shows why. The highest-yielding community, Dubai Sports City at 8.7%, is not the one whose prices are rising fastest. The fastest-growing community, Business Bay at 6.9% YoY, is not the cheapest or the highest-yielding. And the two most prestigious addresses in the city, Palm Jumeirah and Downtown Dubai, post some of the lowest yields and, in Palm's case, by far the lowest transaction volume tracked, meaning the hardest exit if an owner ever needs to sell fast.
None of these facts contradicts the others. They describe three different jobs a Dubai property can do: generate cash flow, grow in value, or hold a scarce asset that trades on scarcity rather than income. This article combines three of Propick's own DLD-sourced datasets, ready-resale yield, year-on-year price change and 2026 year-to-date transaction volume, into one strategy map, as of July 2026, so a buyer can pick a community for the job they actually want done, and see clearly what they trade away to get it.
Three lenses, one dataset
The figures below come entirely from Propick's analysis of Dubai Land Department open data, not a brokerage estimate. Prices and yields are ready-resale medians, with off-plan prices excluded. YoY growth compares 2025 to 2026 ready-resale medians and is only available for the nine communities Propick has tracked across both years. Transaction volume is the full count of 2026 year-to-date residential sales registrations per community. Off-plan share is the proportion of recent deals that were off-plan rather than ready resales, a forward indicator of supply pressure, not an input to yield. One caveat on the YoY figures: they compare period medians, not a repeat-sales or same-unit index, so a shift in the mix of units transacted (a run of larger units, higher floors or better views in one year versus the other) can move the median even if per-unit prices barely change. Single-year swings in this article should be read as directional, not as a certified per-unit appreciation rate.
The cash-flow tier: highest gross yields
Four communities anchor the top of the yield table, and they share a pattern: low price per square metre, small ticket size, and a meaningful off-plan pipeline still working through the system.
| Community | Gross yield | Price, AED/sqm | Median ticket | Off-plan share |
|---|---|---|---|---|
| Dubai Sports City | 8.7% | 10,117 | 660,000 | 63% |
| JVT | 7.8% | 13,140 | 1,150,000 | 83% |
| Dubai South | 7.2% | 11,743 | 776,000 | 76% |
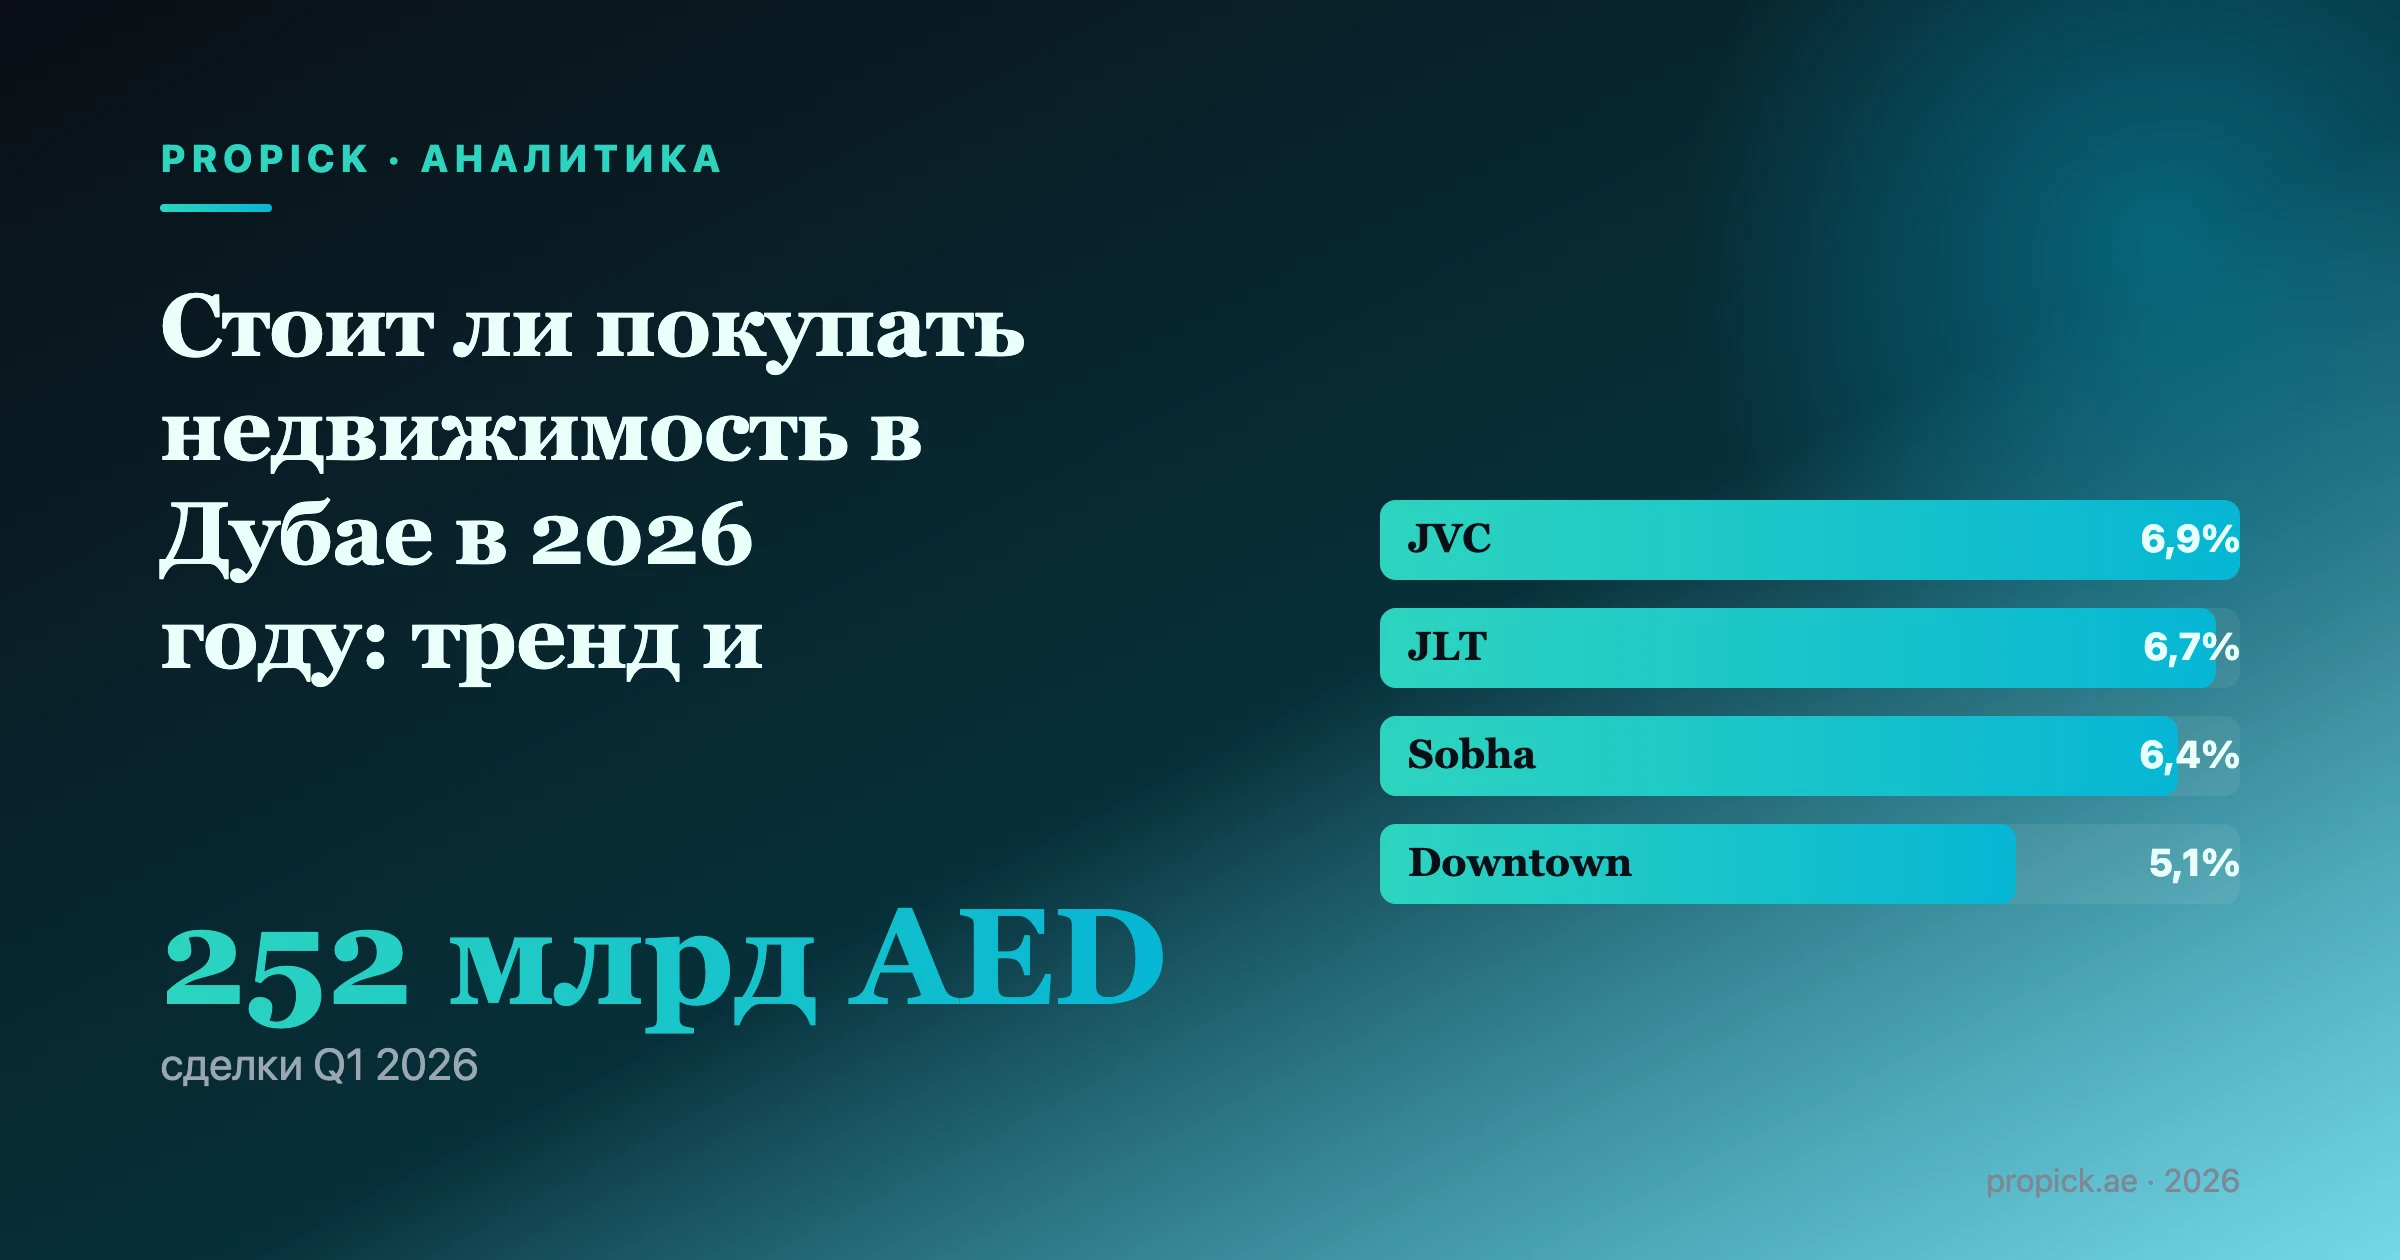
| JVC | 6.9% | 13,697 | 610,000 (studio) | 51% |
Source: Propick analysis of DLD dld_transactions and DLD dld_rent_contracts, ready-resale medians, data as of July 2026.
Dubai Sports City's 8.7% is the highest gross yield Propick tracks anywhere in the city, on the lowest price per square metre (AED 10,117) and the lowest median ticket (AED 660,000) in this analysis. JVT (7.8%) and Dubai South (7.2%) follow the same logic at slightly higher price points. JVC's 6.9% is a notch below those three, but it earns its place here for a different reason, covered below: it is also the single most liquid community in Dubai, by a wide margin. DAMAC Hills, Al Furjan, Town Square and JLT all clear 6.5% too, and behave as secondary cash-flow options once the top four are spoken for.
The growth tier: where prices are actually moving
Yield measures income today. Growth measures whether the asset underneath that income is appreciating, holding flat, or losing value, and the two do not move together.
| Community | YoY price growth | Gross yield | 2026 YTD volume |
|---|---|---|---|
| Business Bay | +6.9% | 5.9% | 2,829 |
| Palm Jumeirah | +5.3% | 5.4% | 593 |
| Dubai Marina | +3.0% | 5.2% | 1,762 |
| JLT | +2.5% | 6.7% | 1,554 |
| Dubai Creek Harbour | +2.3% | 5.4% | 2,242 |
| Dubai Hills Estate | +1.3% | 6.1% | 1,199 |
| JVC | +1.2% | 6.9% | 5,583 |
| Downtown Dubai | -3.3% | 5.1% | 1,048 |
| Sobha Hartland | -4.2% | 6.4% | 635 |
Source: Propick analysis of DLD ready-resale medians, 2025 vs 2026, data as of July 2026. YoY growth is tracked for these nine communities only.
Business Bay leads the whole market at +6.9% year-on-year, a central district still catching up on price, roughly a quarter cheaper per square metre than neighbouring Downtown. Palm Jumeirah's +5.3% is the surprise entry, real capital appreciation on a supposedly "mature" trophy address, second on this list despite one of the lowest yields tracked. At the other end, Downtown Dubai and Sobha Hartland are the only two communities with prices actually falling year-on-year, at -3.3% and -4.2%, exactly the kind of trade-off a simple "top yields" list hides.
The prestige and capital tier: Palm and Downtown
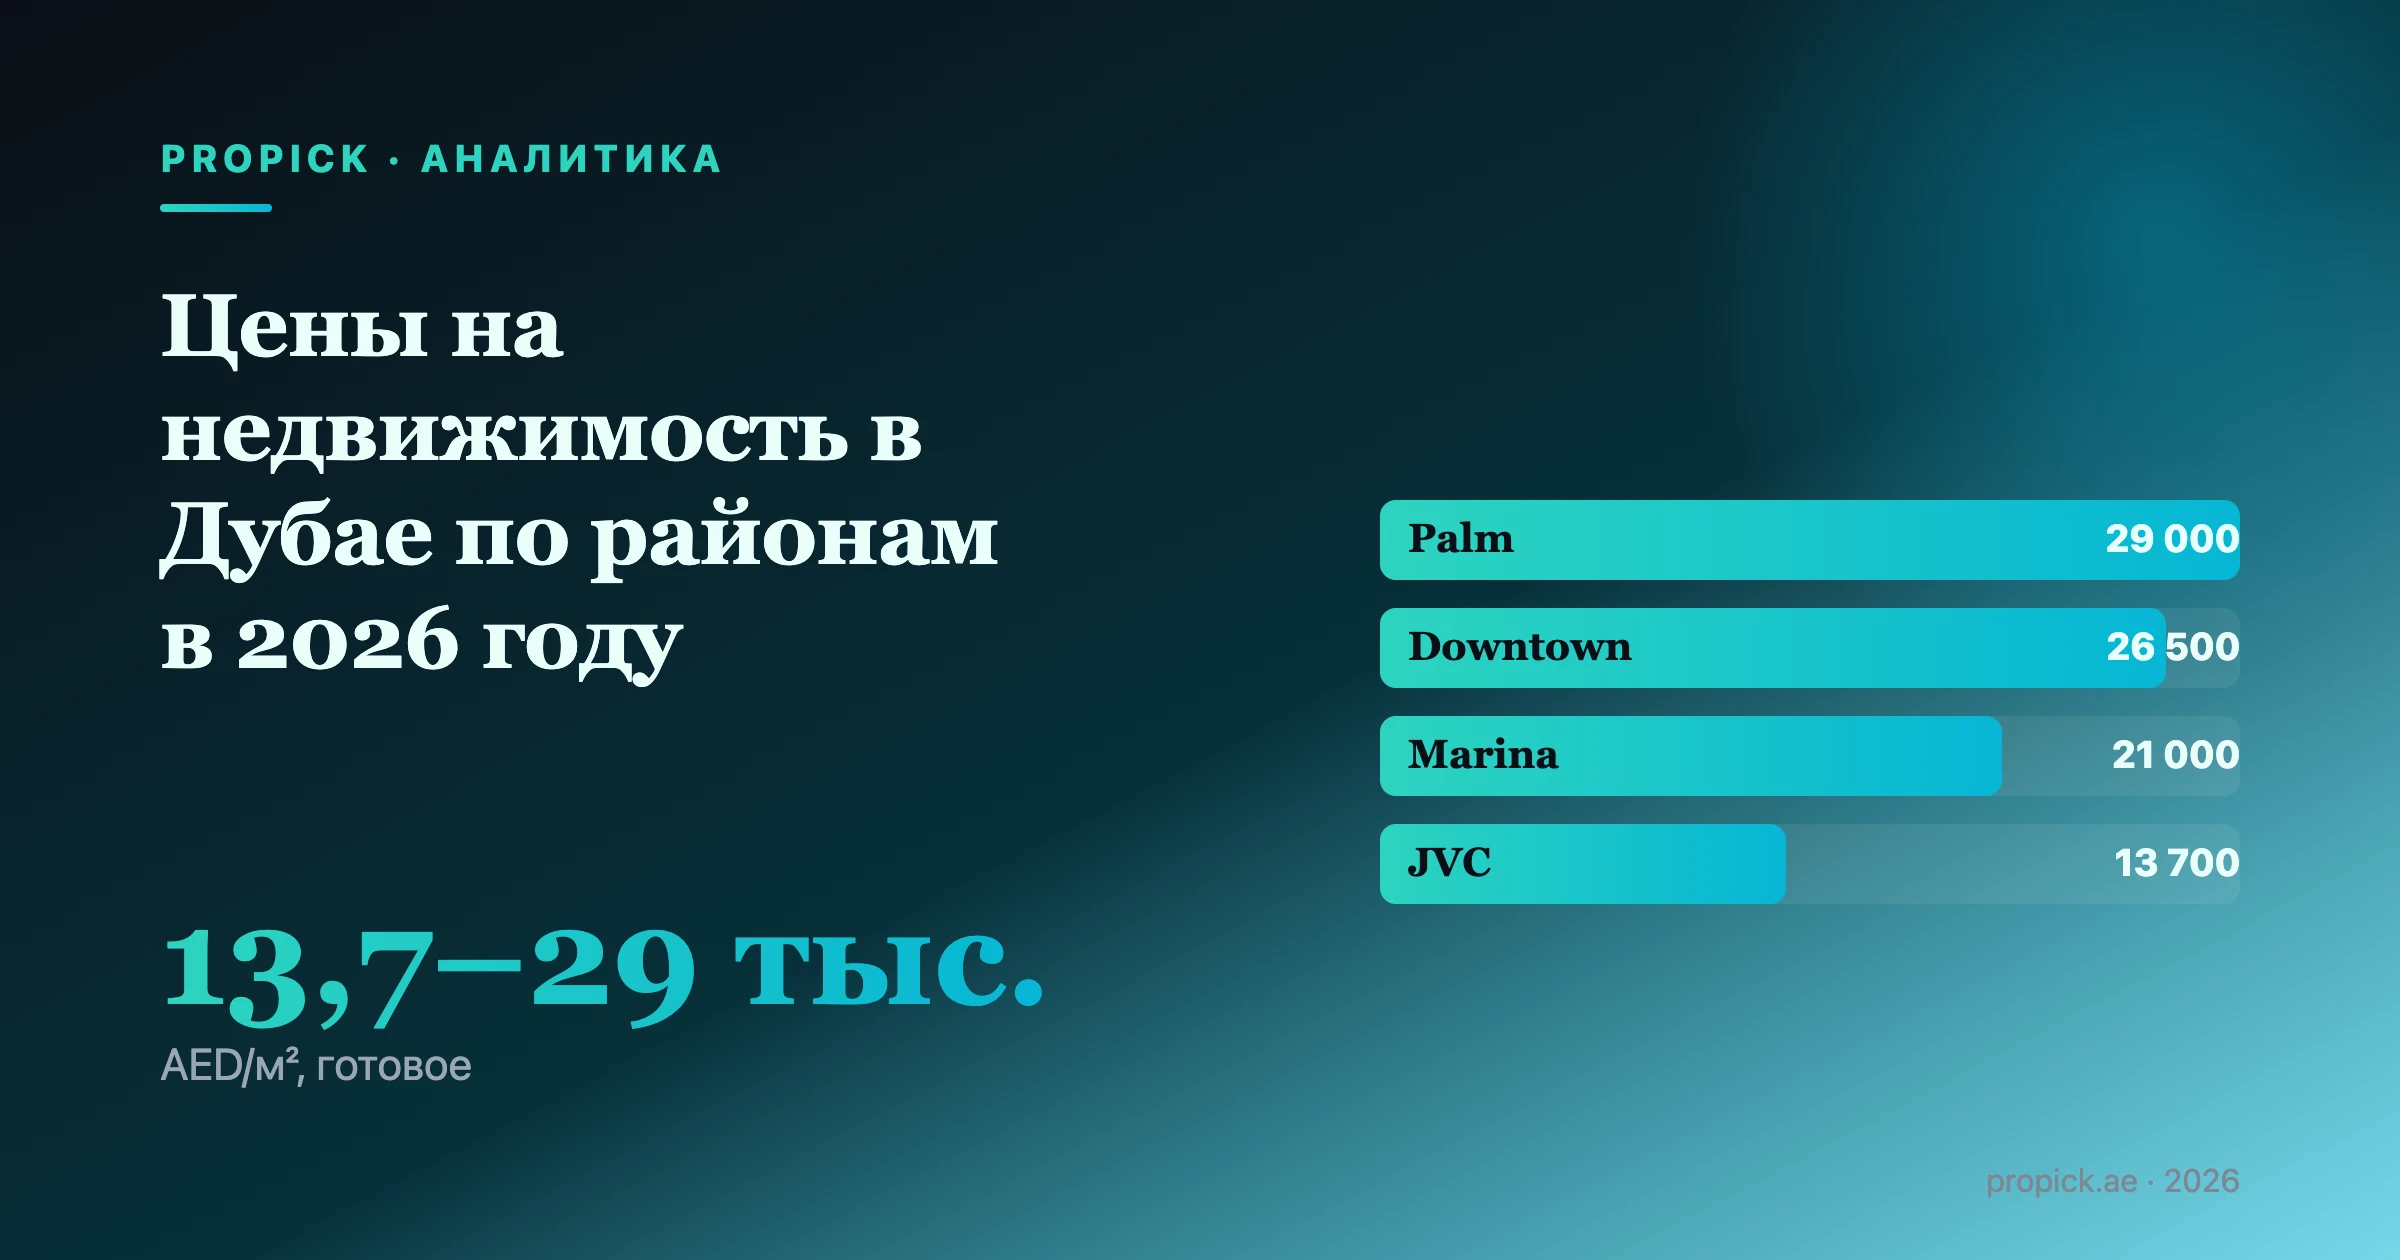
Palm Jumeirah and Downtown Dubai share a profile neither the yield table nor the growth table captures alone: the lowest transaction volumes on Propick's list, 593 and 1,048 deals year-to-date, against 5,583 in JVC. Buyers here are not chasing income; they are paying AED 26,000 to 29,000 per square metre for scarcity and a shot at long-run capital appreciation on an asset that rarely changes hands.
The honest nuance is that scarcity produced two opposite outcomes this year. Palm's price rose 5.3%, rewarding owners who bought for capital growth. Downtown's fell 3.3%, proof that "prestige" is not an automatic hedge against a broader repricing; Downtown also carries the fifth-lowest deal volume in the dataset. Trophy status buys scarcity and, historically, resilience. It does not buy an appreciation guarantee every cycle, and it comes with the hardest exit of any tier, since so few units change hands each year.
Liquidity: the metric nobody asks about until they need to sell
Yield and growth both assume you can find a buyer when you want one. Transaction volume is Propick's proxy for how easy that actually is.
| Community | 2026 YTD volume | Community | 2026 YTD volume |
|---|---|---|---|
| JVC | 5,583 | Meydan | 1,534 |
| Business Bay | 2,829 | Dubai Sports City | 1,509 |
| Dubai Creek Harbour | 2,242 | Dubai Hills Estate | 1,199 |
| Dubai South | 2,182 | Town Square | 1,160 |
| JVT | 1,791 | Downtown Dubai | 1,048 |
| Dubai Marina | 1,762 | Al Furjan | 939 |
| JLT | 1,554 | DAMAC Hills | 799 |
| Sobha Hartland | 635 | ||
| Palm Jumeirah | 593 |
Source: Propick analysis of DLD dld_transactions, full 2026 year-to-date residential sales count per community, data as of July 2026.
JVC's 5,583 registered residential sales year-to-date is roughly double Business Bay in second place, and nearly ten times Palm Jumeirah's 593. That gap is the practical difference between a market where you can usually find a comparable buyer within weeks and one where you may simply be waiting for the right buyer at the right price. Worth noting for context: Dubai's deal mix skews heavily toward outright cash purchases, roughly 81% outright sales against 14% mortgage registrations citywide. That suggests, though it doesn't prove, that liquidity gaps between communities lean more toward genuine buyer appetite than a citywide financing bottleneck; it doesn't rule out community-level financing constraints, such as bank loan-to-value limits or off-plan lending restrictions, playing a role in specific low-volume communities.
The strategy matrix: all 16 communities at a glance
| Community | AED/sqm | Gross yield | YoY growth | 2026 YTD volume | Off-plan share | Primary profile |
|---|---|---|---|---|---|---|
| Palm Jumeirah | 29,036 | 5.4% | +5.3% | 593 | 39% | Prestige / Capital |
| Downtown Dubai | 26,478 | 5.1% | -3.3% | 1,048 | 32% | Prestige (cooling) |
| Dubai Creek Harbour | 25,224 | 5.4% | +2.3% | 2,242 | 70% | Growth |
| Dubai Hills Estate | 25,022 | 6.1% | +1.3% | 1,199 | 62% | Balanced / Growth |
| Sobha Hartland | 21,649 | 6.4% | -4.2% | 635 | 20% | Caution (cooling) |
| Dubai Marina | 21,028 | 5.2% | +3.0% | 1,762 | 22% | Balanced |
| Business Bay | 20,306 | 5.9% | +6.9% | 2,829 | 50% | Growth + Liquidity |
| Meydan | 16,630 | 6.3% | n/a | 1,534 | 93% | Cash Flow (supply-heavy) |
| JLT | 15,666 | 6.7% | +2.5% | 1,554 | 80% | Cash Flow + Growth |
| DAMAC Hills | 15,405 | 6.9% | n/a | 799 | 42% | Cash Flow |
| Al Furjan | 14,446 | 6.9% | n/a | 939 | 52% | Cash Flow |
| Town Square | 14,398 | 6.7% | n/a | 1,160 | 54% | Cash Flow |
| JVC | 13,697 | 6.9% | +1.2% | 5,583 | 51% | Cash Flow + Liquidity |
| JVT | 13,140 | 7.8% | n/a | 1,791 | 83% | Cash Flow (supply-heavy) |
| Dubai South | 11,743 | 7.2% | n/a | 2,182 | 76% | Cash Flow (supply-heavy) |
| Dubai Sports City | 10,117 | 8.7% | n/a | 1,509 | 63% | Cash Flow |
Source: Propick analysis of DLD dld_transactions and DLD dld_rent_contracts, data as of July 2026. "n/a" means Propick has not tracked a two-year price series for that community yet, not that growth is zero.
Villas sit outside this matrix as a distinct asset class: Arabian Ranches villas carry a 4.4% gross yield on a median AED 15,145 per sqm and a AED 6.65 million ticket, against a citywide villa median near AED 3.8 million, a lower-yield, higher-ticket, land-backed profile. See our companion piece on villas versus apartments by yield.
How to pick by goal
- Maximum monthly cash flow on a modest budget: Dubai Sports City, JVT or Dubai South, the three highest yields tracked, all with median tickets under AED 1.2 million.
- Cash flow plus a fast exit: JVC, trading yield leadership for the deepest, most liquid resale market Propick tracks. See our JVC vs JLT comparison.
- Fastest price appreciation right now: Business Bay, +6.9% YoY, combined with a genuinely liquid market and a mid-range 5.9% yield, a rare pairing. See our Business Bay buying guide.
- A trophy asset for capital preservation: Palm Jumeirah, accepting the lowest yield and thinnest resale market in the dataset. Read our Palm Jumeirah buying guide before committing capital you may need back quickly.
- Avoiding near-term oversupply risk: steer clear of the highest off-plan shares in the cash-flow tier, Meydan (93%), JVT (83%) and Dubai South (76%), or budget for the rent pressure once that pipeline completes. See our off-plan versus ready comparison.
The honest trade-offs
No community in this dataset wins on every axis, and that is the real finding here, not any single community's number. JVC delivers yield and liquidity but only modest price growth (+1.2%). Business Bay delivers growth and liquidity but a mid-pack yield (5.9%), well under the cash-flow leaders. Palm delivers genuine appreciation (+5.3%) trapped behind by far the thinnest resale market on the list, a tenth of JVC's transaction count, so paper gains can be slow to realise. Downtown shows that prestige buys scarcity, not an appreciation guarantee, having fallen 3.3% the same year Palm rose 5.3%. Sobha Hartland is the clearest cautionary case: a respectable 6.4% yield sits on top of a 4.2% price decline, so an owner's combined return over the past year could be close to flat or negative depending on entry timing, exactly what a yield figure alone will never show.
The high off-plan shares inside the cash-flow tier, Meydan's 93%, JVT's 83%, Dubai South's 76%, deserve the same scrutiny. A large share of units still under construction in exactly the communities posting today's best yields is a forward supply signal: as that stock hands over, it can compete down the rents that currently support those yields. None of this makes any tier "wrong." Yield, growth and liquidity are three separate prices a buyer pays or collects, and a strategy map only works once you decide which one matters most before looking at any single ranking. On the cost side, budget for the 4% DLD transfer fee, in practice paid in full by the buyer on Dubai's secondary market, regardless of tier.
FAQ
Which Dubai community should I buy for cash flow? Dubai Sports City (8.7%), JVT (7.8%) and Dubai South (7.2%) are the three highest-yielding communities Propick tracks, all with median tickets under AED 1.2 million. JVC (6.9%) trades a slightly lower yield for by far the most liquid resale market.
Which Dubai community is growing fastest in price right now? Business Bay, at +6.9% year-on-year, the fastest of the nine communities Propick tracks for price growth, followed by Palm Jumeirah at +5.3%.
Is Palm Jumeirah still a good investment with only a 5.4% yield? It depends on the goal. Palm posted the second-fastest price growth in the dataset (+5.3% YoY), so it can suit capital-appreciation and trophy-asset buyers. It also has the lowest transaction volume tracked (593 YTD deals), meaning the slowest, least certain exit if liquidity matters to you.
Which Dubai community is easiest to resell if my plans change? JVC, with 5,583 residential sales registered year-to-date in 2026, roughly double the next most liquid community (Business Bay, 2,829) and nearly ten times Palm Jumeirah's 593.
Why did Downtown Dubai and Sobha Hartland prices fall while their yields stayed positive? Both communities recorded negative year-on-year price growth (-3.3% and -4.2%) even though their gross yields remained positive (5.1% and 6.4%). This shows yield and capital growth are separate metrics: a property can generate rental income while its resale value declines, which is why this article tracks both rather than yield alone.
Does a high off-plan share change the yield figures in this article? Not directly. Off-plan launch prices are excluded from the price side of every yield calculation here; only ready-resale medians are used. But a high off-plan share, such as Meydan's 93% or JVT's 83%, signals a large pipeline of new units still to be delivered, which can pressure rents and prices in that community once they complete.
Sources
- Dubai Land Department / DLD Open Data, dld_transactions (open dataset): https://dubailand.gov.ae/en/open-data/real-estate-data/
- Dubai Land Department / DLD Open Data, dld_rent_contracts (open dataset): https://dubailand.gov.ae/en/open-data/real-estate-data/
- Dubai Land Department, Real Estate Open Data portal: https://dubailand.gov.ae/en/open-data/real-estate-data/
- Dubai Land Department, Transfer of Ownership e-service: https://dubailand.gov.ae/en/eservices/request-for-transfer-of-ownership/
- Dubai Land Department, Sale of a Mortgaged Property e-service (4% registration fee): https://dubailand.gov.ae/en/eservices/registering-the-sale-of-a-mortgaged-property/