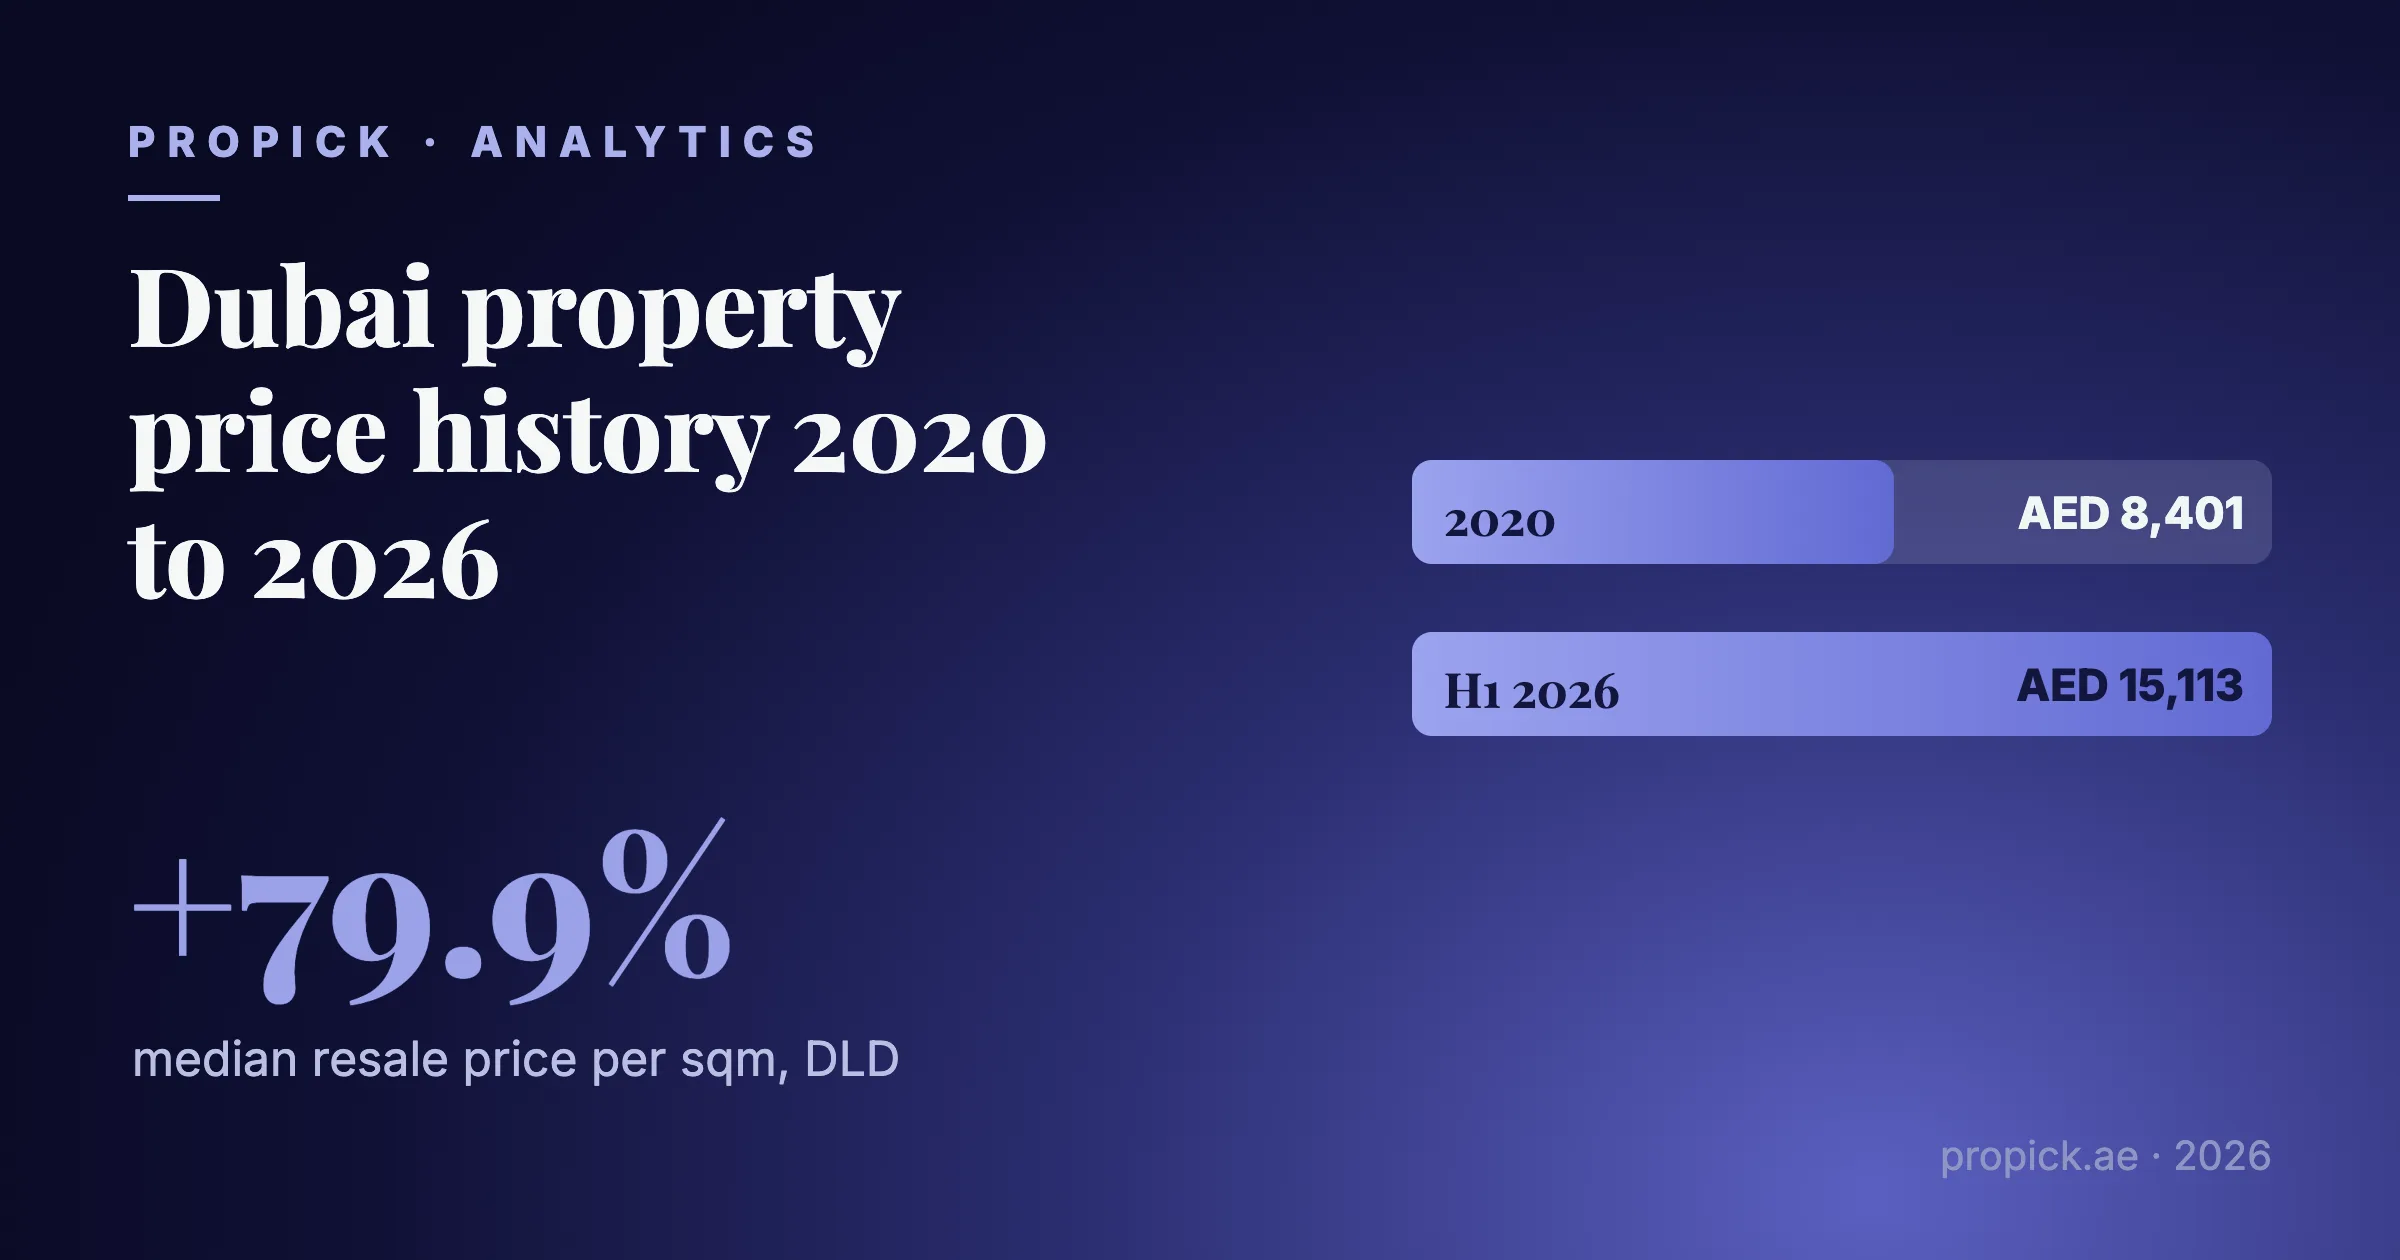
The median resale price per square metre for Dubai property has risen every single year since 2020, from AED 8,401 to AED 15,113 in the first half of 2026, up 79.9%. This is not a single-quarter spike but a six-year run in which every year closed higher than the last, on a transaction sample that grew from 9,911 ready-resale unit sales in 2020 to 44,679 in 2025.
This article builds that index directly from Dubai Land Department (DLD) transaction records, year by year, with the method behind each figure explained so the trend can be checked, not taken on faith.
The Six-Year Price Index
The table covers ready-resale residential unit sales only (completed, existing properties changing hands on the open market, not off-plan launch sales): median price per square metre, the 25th and 75th percentile band around it, median total ticket, and transaction count.
| Year | Median AED/sqm | P25 | P75 | Median ticket (AED) | Transactions (n) |
|---|---|---|---|---|---|
| 2020 | 8,401 | 5,974 | 11,310 | 780,000 | 9,911 |
| 2021 | 10,231 | 6,764 | 14,064 | 998,800 | 19,299 |
| 2022 | 11,389 | 7,766 | 16,849 | 1,013,000 | 28,131 |
| 2023 | 12,225 | 8,506 | 18,568 | 1,015,000 | 36,792 |
| 2024 | 13,316 | 9,308 | 20,045 | 1,048,143 | 42,584 |
| 2025 | 14,527 | 10,459 | 20,961 | 1,090,000 | 44,679 |
| 2026 YTD | 15,113 | 10,980 | 21,413 | 1,145,441 | 17,928 |
2026 figures are year-to-date, covering transactions registered through 30 June 2026, and are a partial year only; they are not directly comparable to the full-year totals above them.
Two numbers anchor the story. Median price per square metre rose from AED 8,401 to AED 15,113, a gain of 6,712 AED/sqm on the 2020 base, or +79.9%. The median total ticket rose from AED 780,000 to AED 1,145,441, a gain of AED 365,441 on the 2020 base, or +46.9%. The per-square-metre gain running well ahead of the ticket-size gain suggests unit sizes changing hands have also shifted over the period, which is why the two percentages diverge.
Reading the Trend Year by Year
No single year in this dataset shows a decline. Year-over-year moves in the median, each computed against the prior year as the base, were +21.8% (2020-21), +11.3% (2021-22), +7.3% (2022-23), +8.9% (2023-24), +9.1% (2024-25), and +4.0% into the partial 2026 read. The steepest gain came early, on a comparatively thin base of 9,911 transactions; every year since has settled into a steadier 7% to 11% band. Because the 2026 figure is year-to-date, that +4.0% is a mid-year checkpoint, not a final annual number.
The median total ticket moved differently: a sharp +28.1% in the first year, then barely any movement for two years (+1.4%, then +0.2%), before a steadier climb of +3.3%, +4.0% and +5.1% into 2026 YTD. Price per square metre and ticket size do not move in lockstep, a reminder that unit mix (the balance of studios, one-beds and larger apartments transacting each year) shifts the total-ticket figure in ways the size-normalised per-square-metre number does not.
Transaction Volume: From a Thin Market to a Deep One
The price trend sits on top of a market that has grown far deeper. Annual ready-resale transaction counts rose from 9,911 in 2020 to 44,679 in 2025, a 4.5x increase in full-year volume, or +350.8% on the 2020 base. That growth decelerated year over year even as it kept climbing (+94.7%, +45.8%, +30.8%, +15.7%, +4.9%), consistent with a market moving from a low base toward a larger, more mature annual volume rather than accelerating indefinitely. The 2026 count of 17,928 is a partial-year figure, not annualised or projected here.
Rising prices have coincided with a much larger number of buyers and sellers transacting, not a shrinking pool of deals at ever-higher prices. A price index built on 44,679 annual transactions (2025) carries materially more statistical weight than one built on 9,911 (2020).
The Widening Spread: Dispersion Between P25 and P75
The gap between the 25th and 75th percentile price per square metre, a simple measure of how dispersed pricing is across the market, has also moved over the period:
| Year | P25 | P75 | Gap (P75 minus P25) |
|---|---|---|---|
| 2020 | 5,974 | 11,310 | 5,336 |
| 2021 | 6,764 | 14,064 | 7,300 |
| 2022 | 7,766 | 16,849 | 9,083 |
| 2023 | 8,506 | 18,568 | 10,062 |
| 2024 | 9,308 | 20,045 | 10,737 |
| 2025 | 10,459 | 20,961 | 10,502 |
| 2026 YTD | 10,980 | 21,413 | 10,433 |
In absolute AED terms, the gap between the cheaper and pricier quarters of the market nearly doubled, from 5,336 AED/sqm in 2020 to 10,433 AED/sqm in 2026 YTD, up 95.5% on the 2020 base. Scaled against each year's own median, the gap rose from 63.5% of median in 2020 to a peak of 82.3% in 2023, then eased to 80.6%, 72.3% and 69.0% by 2026 YTD. Relative dispersion widened fastest in the first four years, then moderated, even as the absolute AED gap kept growing alongside the overall price level.
Why Ready-Resale, Not Off-Plan
Every figure here is built from ready-resale transactions: sales of existing, already-completed residential units on the open market. Off-plan launch sales are deliberately excluded, because a developer sets an off-plan unit's headline price years before completion, shaped by payment-plan structuring and launch-phase promotional pricing rather than open-market discovery between two independent parties. Mixing that into a year-by-year index would distort the trend with developer pricing decisions rather than the market clearing price for existing stock. Ready-resale is the closest proxy in DLD data to "what an existing Dubai property is actually worth this year."
Is 2026 a Bubble or a Trend?
Based on this dataset alone: six consecutive years of rising median price per square metre, on a sample that grew from under 10,000 to nearly 45,000 deals a year, is not consistent with a single-year spike, which would show up as a sharp move followed by a reversal or a flat plateau. What this data shows instead is deceleration, large early gains settling into a steadier multi-year climb rather than reversing. It does not guarantee any particular outcome for the rest of 2026; the figures here cover transactions registered through 30 June 2026 only.
FAQ
Has Dubai's property market really risen every year since 2020? Yes, based on median resale price per square metre from DLD data: 8,401, 10,231, 11,389, 12,225, 13,316, 14,527, and 15,113 AED per square metre, one higher than the last, every year from 2020 through H1 2026 (through 30 June 2026).
Is the AED 15,113 per sqm figure for 2026 a full-year number? No. It is year-to-date, covering transactions registered through 30 June 2026, based on 17,928 transactions so far, and is not directly comparable to the full-year totals for 2020 through 2025.
Why use median price per square metre instead of average price? Median is far less sensitive to a small number of unusually large or small transactions, so it reflects the typical transaction in each year's sample.
Why does this article exclude off-plan sales? Off-plan launch prices are set by developers ahead of completion, shaped by payment-plan structuring rather than open-market negotiation. Including them would distort the trend with developer pricing decisions rather than market clearing prices.
Is the gap between cheaper and pricier properties getting wider? In absolute AED per square metre terms, yes: the 25th-to-75th percentile gap widened from 5,336 in 2020 to 10,433 in 2026 YTD, up 95.5%. Relative to each year's own median, it peaked in 2023 at 82.3% and has since eased to 69.0%, so the market is less stretched relative to its price level than three years ago, even as the raw AED gap keeps growing.
Methodology & Sources
This index is Propick's own analysis of DLD transaction data, not sourced from any broker, agency or third-party market report. The data is accessed via the data.dubai API gateway, which republishes the same Real Estate Data dataset DLD also publishes on its public Open Data portal, so the two are the same underlying source reached through different access channels.
Scope: ready-resale residential unit sales only, existing (already-completed) properties on the open market. Off-plan launch sales are excluded by design (see "Why Ready-Resale, Not Off-Plan" above). Property type filter: units only (apartments); villas, townhouses, buildings and land plots are excluded from the property_type filter used to build this dataset. Geographic scope: all Dubai emirate-registered transactions, not limited to specific areas or master projects.
Price per square metre: median of transaction-level meter sale price (meter_sale_price) per calendar year. Median ticket: median of total transacted sale price across the same yearly set. Percentiles (P25/P75): 25th and 75th percentile of meter sale price within each year's set, showing spread around the median rather than a single point estimate. Sample size (n): count of qualifying transactions per year, from 9,911 (2020) to 44,679 (2025); the 2026 figure (n=17,928) is partial-year.
2026 data: year-to-date, covering transactions registered through 30 June 2026 and extracted in July 2026. Full-year figures are not yet available and are not estimated or projected here.
Source: Dubai Land Department (DLD), Open Data: Real Estate Data, DLD Open Data: Real Estate Data, accessed via the data.dubai API gateway.
CTA: {{leave phone / WhatsApp}}