Rental yield is the number that actually decides whether a Dubai apartment is a good investment, not the price tag on the sales brochure. Two units can sell for the same amount per square foot and still hand their owners very different returns, depending on what a tenant will actually pay to live there.
To answer the question properly for 2026, Propick pulled and cross-matched two official Dubai Land Department datasets published on the DLD Open Data open data platform: dld_transactions, which records every registered sale, and dld_rent_contracts, which records every tenancy contract registered through Ejari. Matching ready-apartment sale prices against new Ejari rents in the same community gives a gross yield figure that is close to what an owner actually experiences, rather than a marketing estimate.
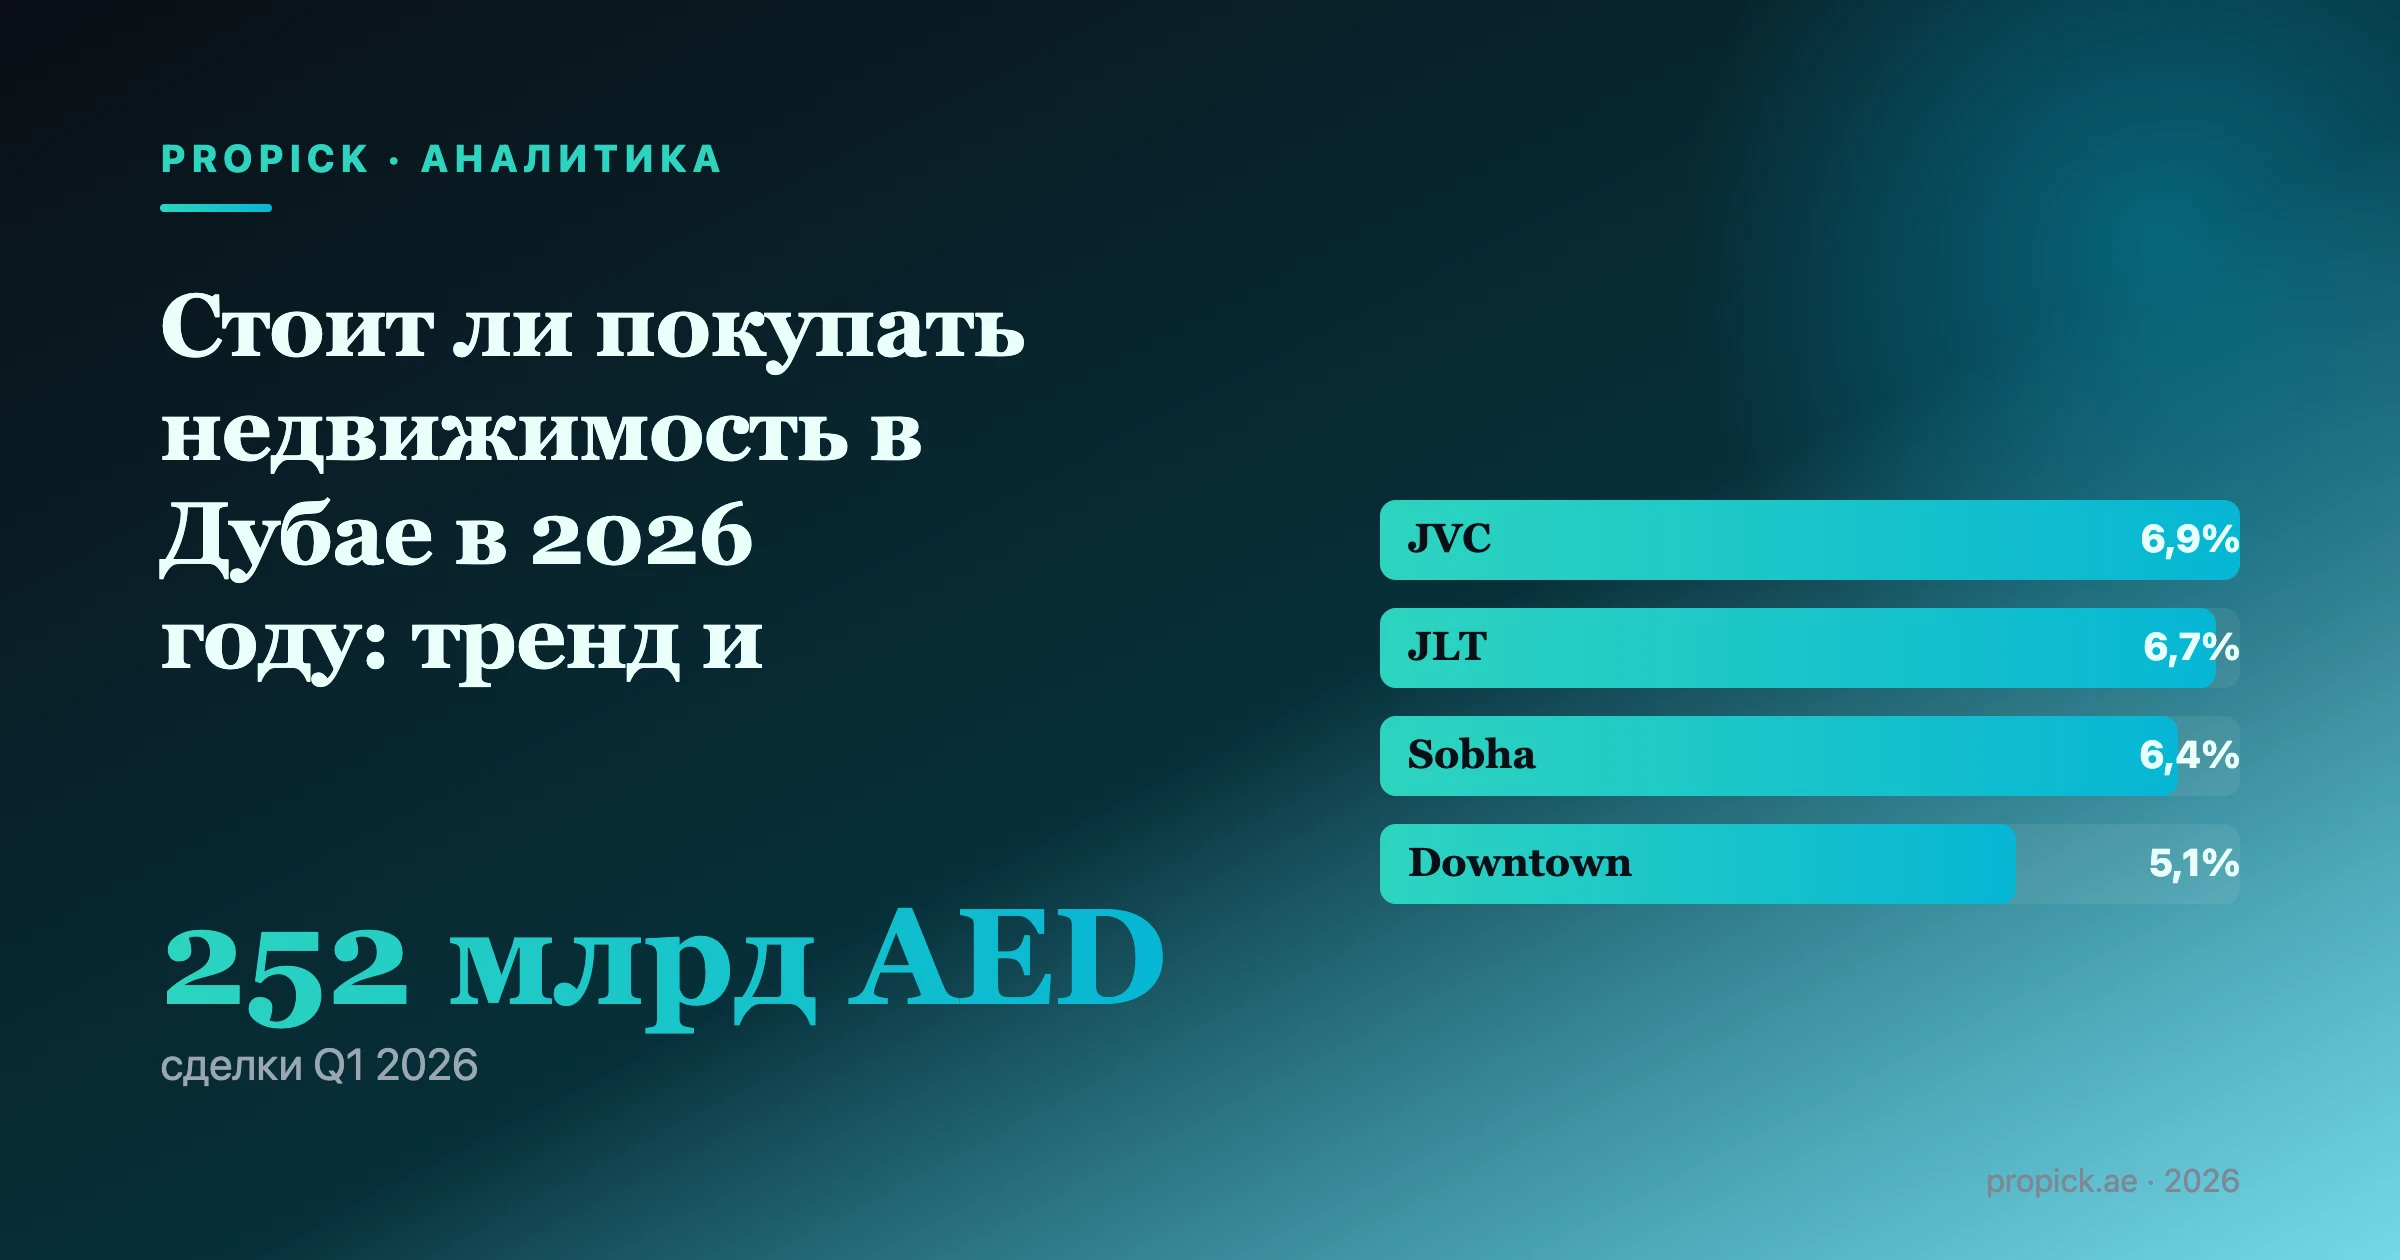
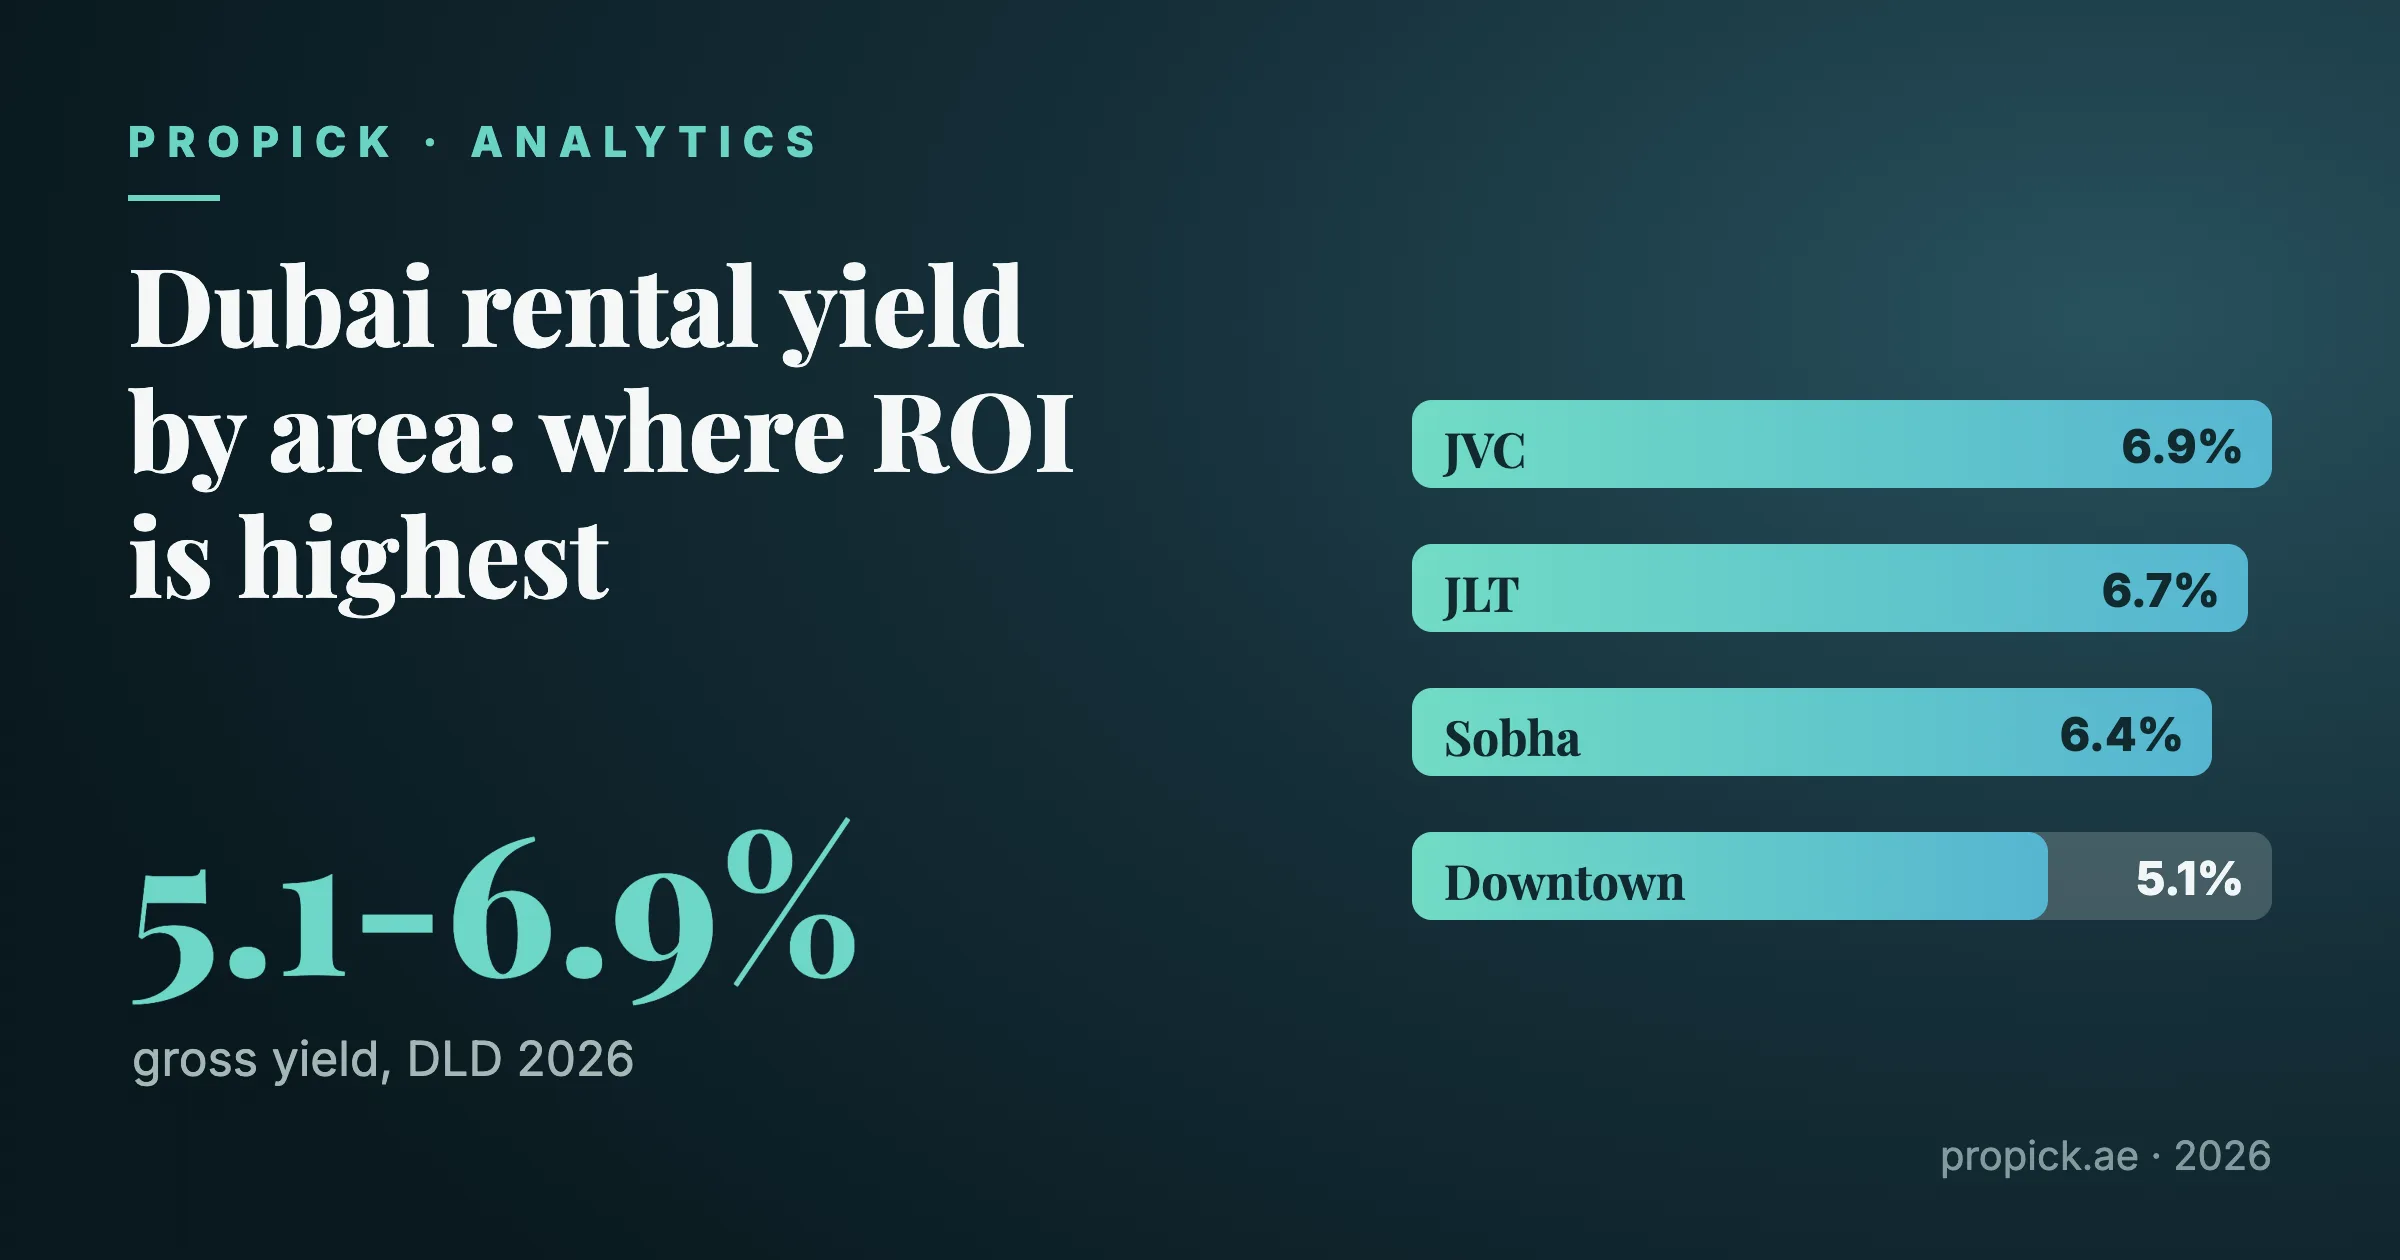
The headline finding: yield and price move in almost the opposite direction. The most affordable established communities, JVC, JLT and Business Bay, post gross yields above 6%, while the most prestigious waterfront addresses, Palm Jumeirah, Downtown Dubai and Dubai Marina, settle closer to 5%. Neither end of the range is "wrong" for every buyer; they simply serve different investment goals, which this article breaks down community by community.
Methodology: how these yields were calculated
The figures below come from Propick's own analysis of DLD open data, not a survey or a broker estimate. The scope and rules matter, so here they are in full:
- Scope: ready (completed) apartments only, excluding off-plan launch prices from the price side of the calculation. Off-plan share is shown separately as a percentage of deals in each community, because it affects how a market is trading even when it is not used to set the yield.
- Grouping: transactions and rent contracts are grouped by community (DLD's master_project field), using up to the 1,000 most recent records per community from dld_transactions and dld_rent_contracts.
- Price: median resale price per square metre for ready units in the community.
- Rent: median new (non-renewal) annual rent per square metre from Ejari registrations in the same community.
- Gross yield: median annual rent per sqm divided by median ready price per sqm. This is a gross figure; it does not net out service charges, maintenance, agency fees or vacancy periods, which we address further down.
- Data as of: July 2026.
This mirrors the same underlying datasets used in our companion piece on Dubai property prices by area in 2026, so the two articles can be read side by side without a mismatch in sourcing.
Gross rental yield by community, 2026
| Community | Price, AED/sqm | Gross yield | Off-plan share | Studio (median) | 1BR (median) | 2BR (median) |
|---|---|---|---|---|---|---|
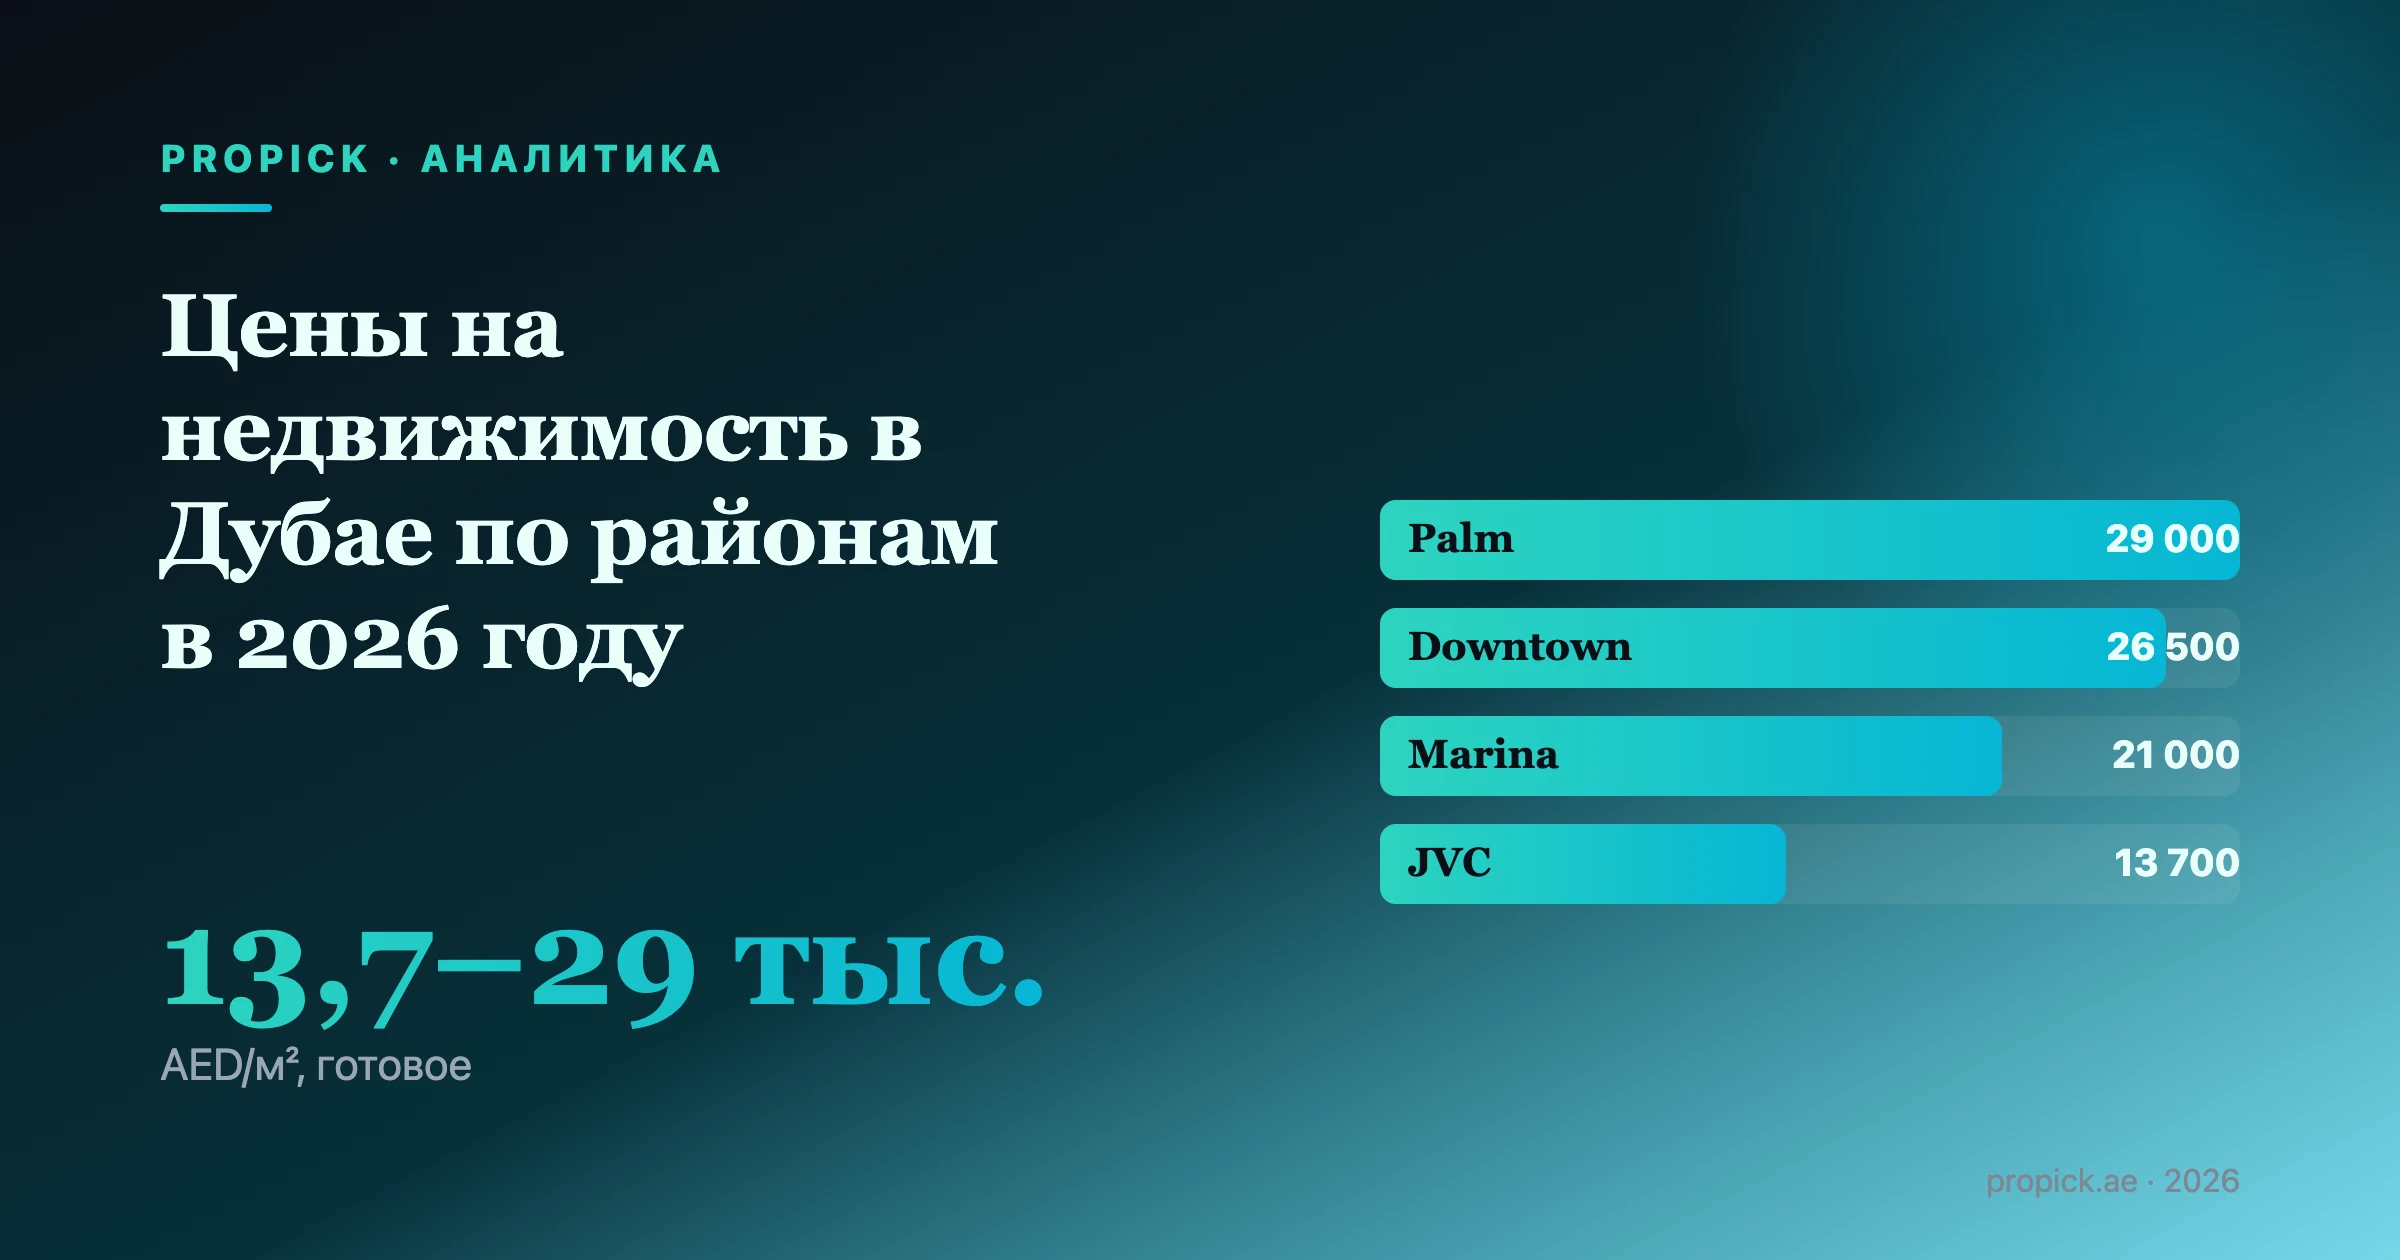
| Palm Jumeirah | 29,036 | 5.4% | 39% | 1,500,000 | 3,050,000 | 4,700,000 |
| Downtown (Burj Khalifa) | 26,478 | 5.1% | 32% | 1,175,000 | 2,000,000 | 3,450,000 |
| Dubai Creek Harbour | 25,224 | 5.4% | 70% | - | 1,730,000 | 2,650,000 |
| Dubai Hills Estate | 25,022 | 6.1% | 62% | 1,020,000 | 1,485,000 | 2,400,000 |
| Sobha Hartland | 21,649 | 6.4% | 20% | 965,000 | 1,350,000 | 2,340,000 |
| Dubai Marina | 21,028 | 5.2% | 22% | 1,060,000 | 1,690,000 | 2,600,000 |
| Business Bay | 20,306 | 5.9% | 50% | 1,020,000 | 1,500,000 | 2,254,058 |
| JLT | 15,666 | 6.7% | 80% | 772,517 | 1,125,000 | 1,950,000 |
| JVC | 13,697 | 6.9% | 51% | 610,000 | 1,000,000 | 1,450,000 |
Source: Propick analysis of DLD dld_transactions and DLD dld_rent_contracts, ready apartments, medians per community, data as of July 2026.
The highest-yield areas: JVC, JLT and Business Bay
Jumeirah Village Circle (JVC) tops the list at a 6.9% gross yield on a median entry price of AED 13,697 per sqm, the lowest price per square metre of any community in this table. A studio here has a median price of AED 610,000, which keeps the ticket size accessible to first-time overseas buyers and to landlords chasing pure cash flow rather than prestige. JLT (Jumeirah Lakes Towers) is close behind at 6.7%, helped by an established rental base and mature infrastructure, though it also has the highest off-plan share in the table at 80%, meaning most current sales activity there is for units still under construction rather than the ready stock this yield is measured against.
Business Bay's 5.9% yield sits in the middle of the pack, combining a central, walkable location near Downtown with pricing still well below Downtown itself (AED 20,306 vs AED 26,478 per sqm). Sobha Hartland (6.4%) and Dubai Hills Estate (6.1%) round out the higher-yield group, both newer master communities where rents have kept pace with still-moderate resale prices. If cash-on-cash return is the primary objective, these five communities are where the DLD data currently points.
The prime/lower-yield areas: Palm Jumeirah, Downtown, Marina
Palm Jumeirah and Dubai Creek Harbour both post a 5.4% yield, Downtown Dubai 5.1%, and Dubai Marina 5.2%. These are lower than the JVC/JLT tier, but that is the normal trade-off for trophy locations: buyers are paying a premium (AED 25,000-29,000 per sqm) for scarcity, branding, and long-run capital appreciation rather than for maximum monthly cash flow. A 2BR on Palm Jumeirah carries a median price of AED 4.7 million, more than three times the same configuration in JVC, but it also tends to hold value and attract long-stay premium tenants more reliably through market cycles.
For buyers weighing yield against appreciation and lifestyle, our guide to the best areas to buy property in Dubai in 2026 breaks down this trade-off in more depth, area by area.
Off-plan share: what it tells you (and what it doesn't)
The off-plan percentage in the table is the share of recent deals in that community that were off-plan launches rather than resales of completed units. It ranges from 20% in Sobha Hartland to 80% in JLT and 70% in Dubai Creek Harbour. A high off-plan share does not change the yield number, since off-plan prices are deliberately excluded from this calculation, but it does mean two things worth knowing before you buy: first, the pool of comparable ready resales used to set the price benchmark is smaller relative to overall market activity; second, a large share of new supply is still being delivered, which can put downward pressure on rents once those units complete and reach the rental market. Anyone comparing an off-plan unit's projected yield against the ready-market figures in this table should read our dedicated comparison, Off-Plan vs Ready Property in Dubai: What to Choose, before committing.
Market context: yields are moderating in 2026
Citywide, brokerage research points the same direction as the community data above. CBRE's UAE Real Estate Market Review, Q1 2026 recorded overall Dubai residential sales prices up 9.1% year-on-year (apartments up 8.5%), while rents rose a more modest 4.1% year-on-year overall (apartments up 4.9%, villa rents roughly flat), a pace of rental growth that has been easing since late 2022 as new completions add to available stock. ValuStrat's Dubai Residential Price Index has likewise shown capital values softening through mid-2026 after a strong start to the year, which is consistent with yields stabilising rather than compressing further as more supply comes online.
None of this means yields are falling everywhere. It means the gap between "core cash-flow" communities and "core capital-appreciation" communities, visible clearly in the table above, is becoming more important to factor into a purchase decision than it was during the sharper price growth of 2023-2024.
Costs that affect your net yield
The yields above are gross. Before comparing them to a rental return in another country, budget for the costs on top:
- DLD registration fee: a 4% DLD registration fee, in practice almost always paid in full by the buyer on the Dubai secondary market, applies at the point of transfer of ownership, plus fixed administrative charges for the title deed and property map.
- Ejari registration: a small annual fee to register the tenancy contract, which is also the dataset this article's rent figures are drawn from.
- Rent increases on renewal: capped by DLD's Rental Index (the Smart Rental Index, in force since January 2025), which limits how much a landlord can raise rent on an existing tenant depending on how far below the market benchmark the current rent sits.
- Agency and management fees, service charges and periods of vacancy, all of which reduce gross yield down to a real net figure. Service charges are the single biggest variable here and differ by building, set annually against DLD's Service Charge Index, so budget per building rather than assuming a fixed discount from gross to net.
Unlike many countries where rental income and property ownership are also subject to annual property tax, the UAE currently levies no personal income tax and Dubai has no annual municipal property tax on residential ownership, which is one reason gross and net yields stay closer together here than in many comparable international markets. For a broader view of how yield fits into the investment case as a whole, see Is Dubai Real Estate a Good Investment in 2026?.
FAQ
Which Dubai area has the highest rental yield in 2026? Based on Propick's analysis of DLD sale and Ejari rent data, JVC currently has the highest gross yield among the communities tracked, at 6.9%, followed by JLT at 6.7% and Sobha Hartland at 6.4%. See the dld_transactions and dld_rent_contracts datasets for the underlying records.
Is a 5% yield in Dubai good? Yes, relative to many mature global cities. Propick's DLD-based analysis above shows gross yields for ready apartments ranging from 5.1% in Downtown Dubai up to 6.9% in JVC across the tracked communities, so a well-located prime asset yielding 5.1-5.4%, like Downtown Dubai or Palm Jumeirah in the table above, is trading its cash-flow return for stronger long-run capital appreciation and liquidity.
How is rental yield calculated in this article? Gross yield equals the median new annual Ejari rent per square metre in a community divided by the median resale price per square metre for ready apartments in the same community, using up to the 1,000 most recent records per community from official DLD datasets on DLD Open Data. It is a gross figure, before costs.
Does off-plan buying affect these yield numbers? Not directly. Off-plan launch prices are excluded from the price side of the calculation; only ready-unit resales are used. The off-plan percentage shown for each community is a separate market-activity indicator, not an input to the yield figure.
How much does the DLD registration fee reduce my net return? Budget for a 4% DLD registration fee, in practice almost always paid in full by the buyer on the Dubai secondary market, at the point of property transfer. It is a one-time acquisition cost, not an annual charge, so it affects your total return over the holding period rather than your ongoing yield.
Can my rent be increased freely on renewal? No. Rent increases on an existing tenancy are capped under DLD's Rental Index rules, which set a maximum permitted increase based on how far the current rent sits below the benchmark for that area and property type.
Sources
- Dubai Land Department / DLD Open Data, dld_transactions (open dataset): https://dubailand.gov.ae/en/open-data/real-estate-data/
- Dubai Land Department / DLD Open Data, dld_rent_contracts (open dataset): https://dubailand.gov.ae/en/open-data/real-estate-data/
- Dubai Land Department, Rental Index (Smart Rental Index): https://dubailand.gov.ae/en/eservices/rental-index/rental-index/
- Dubai Land Department, Transfer of Ownership e-service: https://dubailand.gov.ae/en/eservices/request-for-transfer-of-ownership/
- Dubai Land Department, Sale of a Mortgaged Property e-service (4% registration fee): https://dubailand.gov.ae/en/eservices/registering-the-sale-of-a-mortgaged-property/
- Dubai Land Department, Service Charge Index: https://dubailand.gov.ae/en/eservices/service-charge-index-overview/
- Dubai Land Department, Open Data portal: https://dubailand.gov.ae/en/open-data/real-estate-data/
- UAE Government Portal, Taxation (no personal income tax): https://u.ae/en/information-and-services/finance-and-investment/taxation
- CBRE, UAE Real Estate Market Review, Q1 2026: https://www.cbre.ae/insights/figures/uae-real-estate-market-review-q1-2026
- ValuStrat, Dubai Residential Price Index (VPI): https://valustrat.com/products/valustrat-price-index-dubai-residential-march-2026