Every Dubai property pitch talks about price and yield. Almost none of them talk about the question that actually matters the day you decide to sell: how many buyers are out there, how many comparable units have changed hands recently, and how long a realistic sale takes at a fair price. That is liquidity, and it varies enormously across Dubai's freehold communities, in ways the headline price-per-square-metre numbers do not show on their own.
Propick pulled full-pagination transaction counts for 2026 year-to-date from the Dubai Land Department's dld_transactions dataset across the same 16 master-project communities we track for price and yield, then set that volume figure against each community's off-plan share and recent price direction. The result is a practical map of exit risk: where a sale is fast and well-priced because the market is deep, and where it can take longer and depend more on finding the right buyer because the market is thin. Neither is automatically the wrong choice. It depends on how long you plan to hold, and whether you need the exit to be fast.
Methodology: measuring liquidity, not just price
Transaction volume figures are exact 2026 year-to-date counts of registered residential sales, taken from full pagination of DLD's dld_transactions dataset, grouped by master-project community, not a sample. This is a total transaction count, combining off-plan (developer) sales and secondary-market resales, because DLD's public dataset does not separate the two at the transaction level; for communities with a high off-plan share, a meaningful part of that headline volume is developer sales rather than owner resales, a distinction the off-plan-share section below unpacks in detail. Price, gross yield and off-plan share are Propick's own ready-resale medians for the same communities, methodology detailed in our rental yield coverage. Villa-only master communities such as Arabian Ranches are tracked separately in our price data and are not part of this apartment-focused volume comparison. Data as of July 2026.
Dubai's liquidity ranking: 2026 transaction volume by community
| Rank | Community | 2026 YTD sales | Off-plan share | Ready-resale price (AED/sqm) | Gross yield |
|---|---|---|---|---|---|
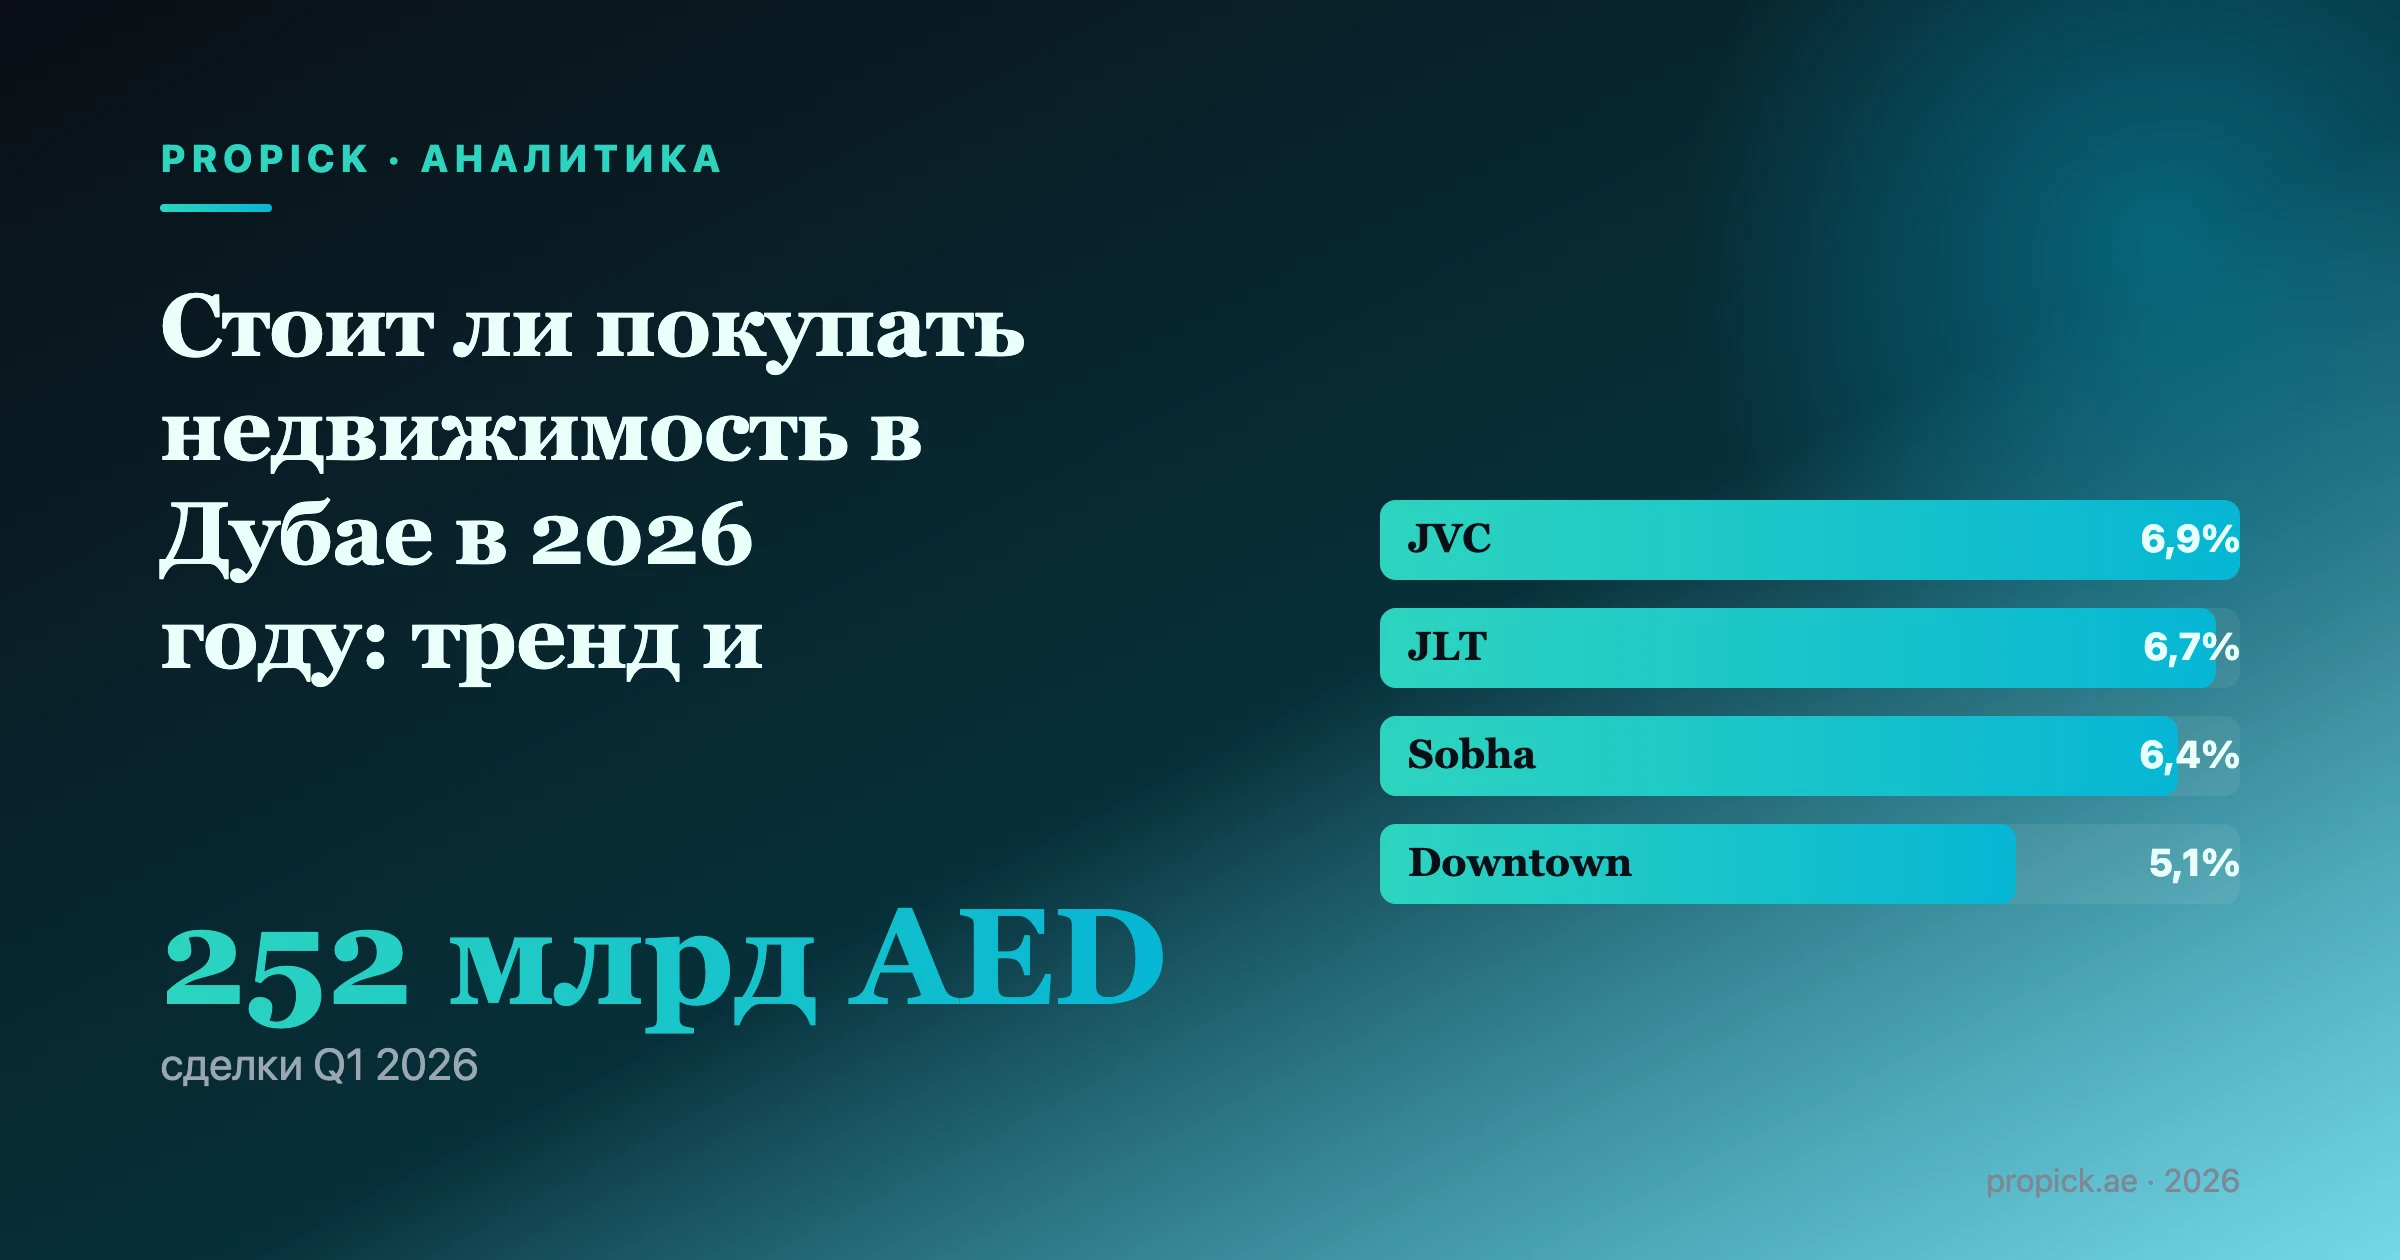
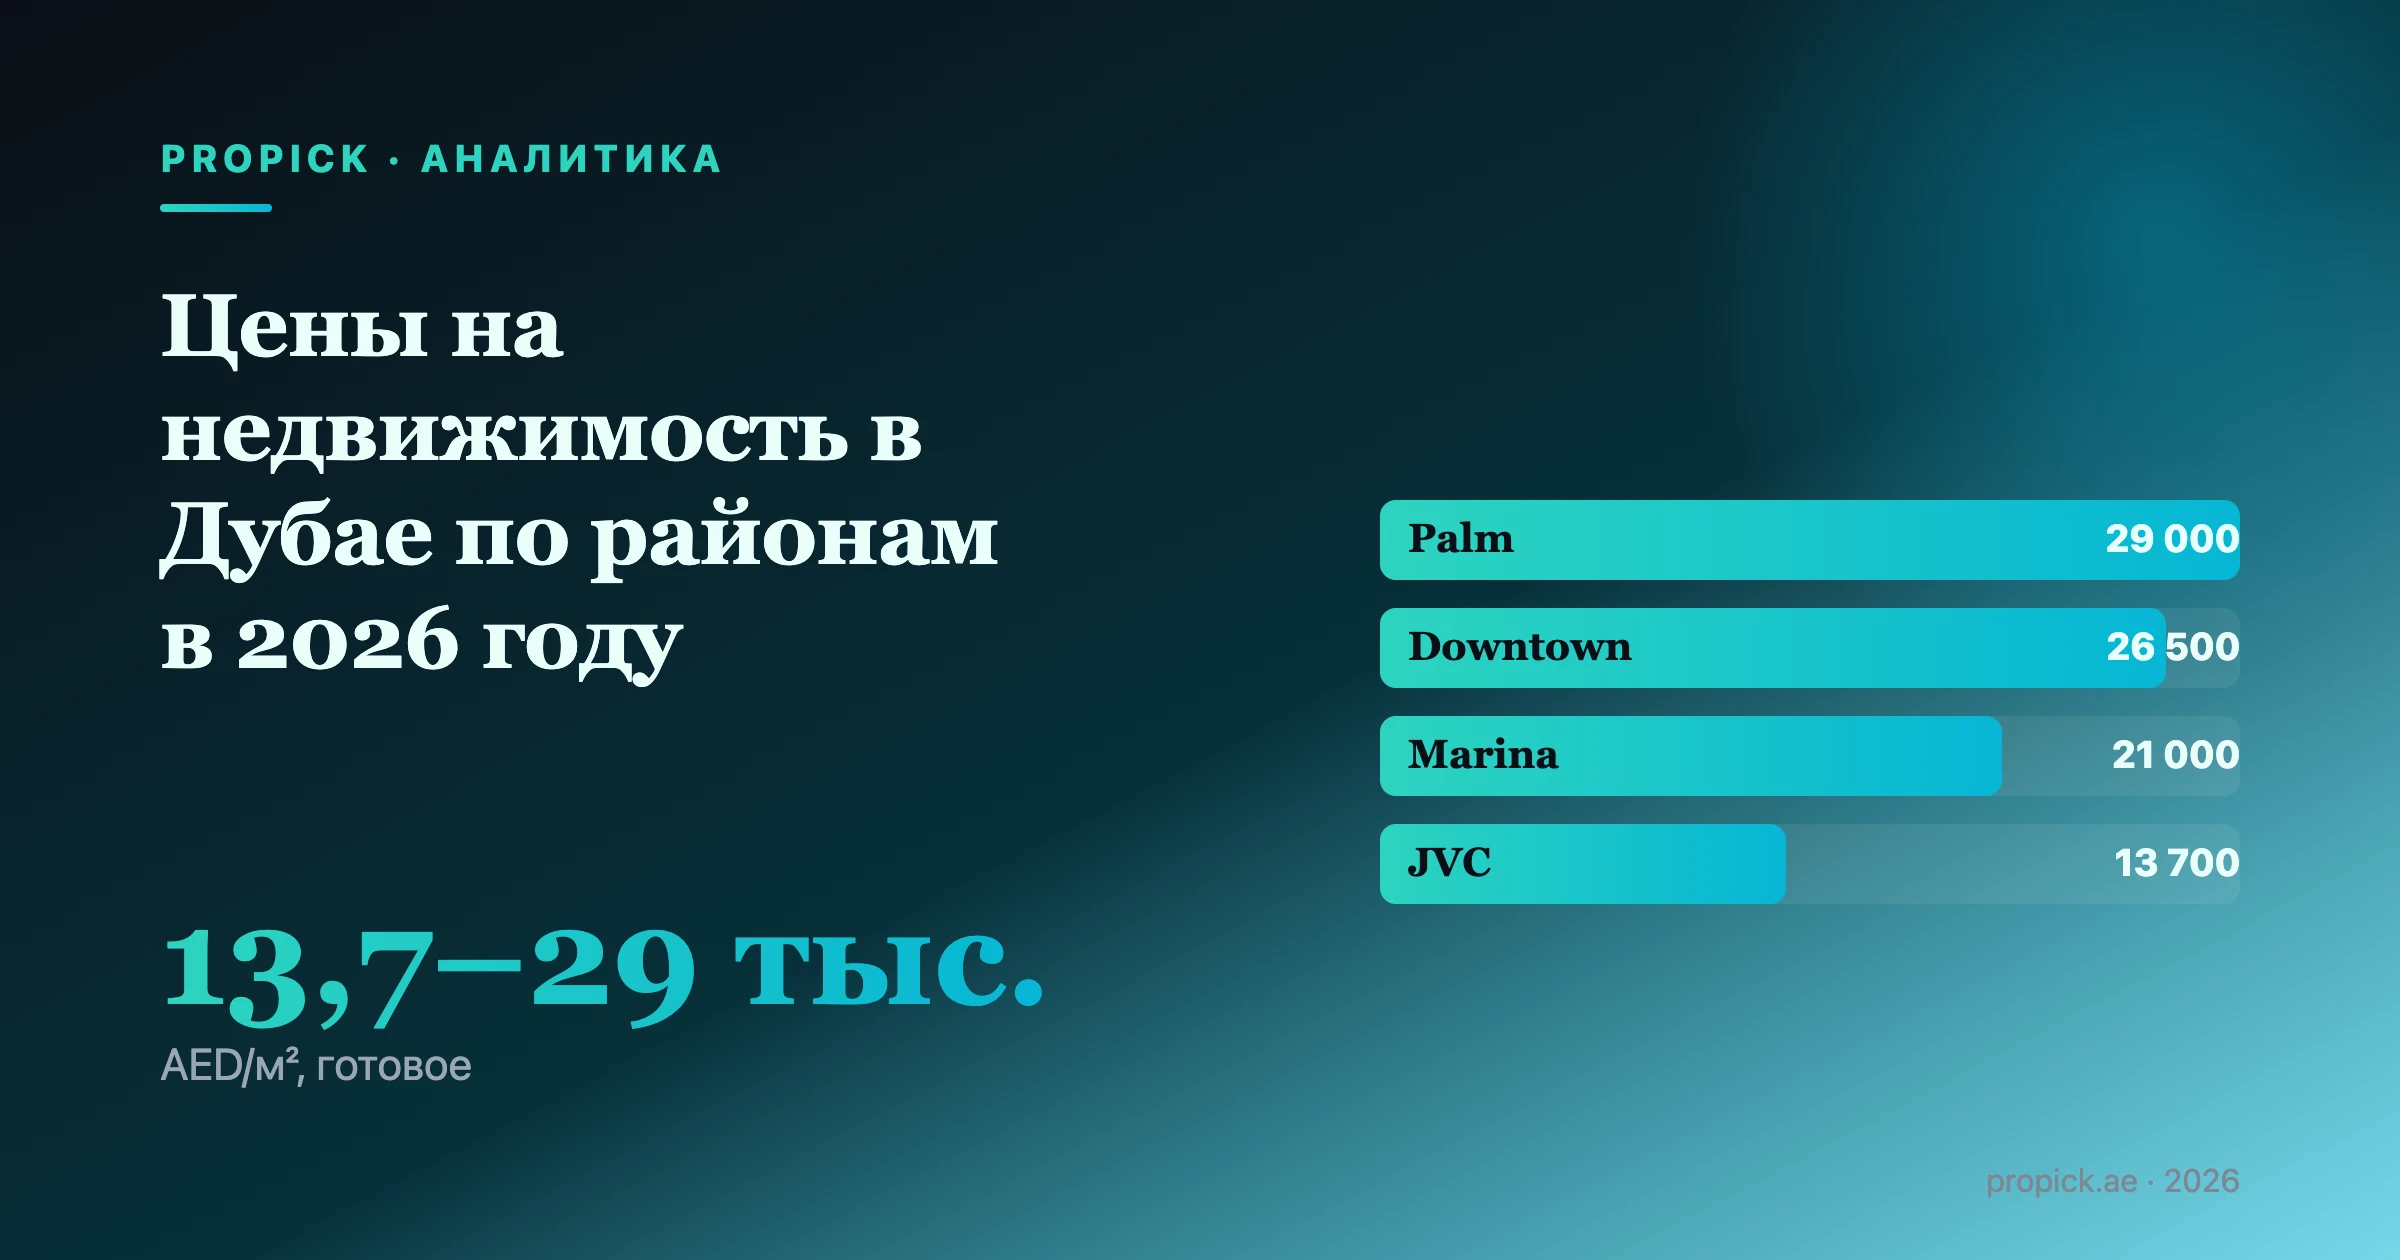
| 1 | JVC | 5,583 | 51% | 13,697 | 6.9% |
| 2 | Business Bay | 2,829 | 50% | 20,306 | 5.9% |
| 3 | Dubai Creek Harbour | 2,242 | 70% | 25,224 | 5.4% |
| 4 | Dubai South | 2,182 | 76% | 11,743 | 7.2% |
| 5 | JVT | 1,791 | 83% | 13,140 | 7.8% |
| 6 | Dubai Marina | 1,762 | 22% | 21,028 | 5.2% |
| 7 | JLT | 1,554 | 80% | 15,666 | 6.7% |
| 8 | Meydan | 1,534 | 93% | 16,630 | 6.3% |
| 9 | Dubai Sports City | 1,509 | 63% | 10,117 | 8.7% |
| 10 | Dubai Hills Estate | 1,199 | 62% | 25,022 | 6.1% |
| 11 | Town Square | 1,160 | 54% | 14,398 | 6.7% |
| 12 | Downtown Dubai | 1,048 | 32% | 26,478 | 5.1% |
| 13 | Al Furjan | 939 | 52% | 14,446 | 6.9% |
| 14 | DAMAC Hills | 799 | 42% | 15,405 | 6.9% |
| 15 | Sobha Hartland | 635 | 20% | 21,649 | 6.4% |
| 16 | Palm Jumeirah | 593 | 39% | 29,036 | 5.4% |
Source: Propick analysis of DLD dld_transactions, full pagination, 2026 YTD, by master-project community.
JVC alone recorded nearly two times the sales of second-placed Business Bay, and more than nine times Palm Jumeirah's total. That gap is the entire story of this article in one number.
What high transaction volume actually buys you at exit
JVC, Business Bay, Dubai Creek Harbour and Dubai South make up Dubai's four highest-volume communities, each clearing well over 2,000 sales in 2026 alone (JVC 5,583, Business Bay 2,829, Creek Harbour 2,242, Dubai South 2,182). Volume at this scale means two things for anyone planning to exit later. Price discovery is tight, since thousands of comparable deals a year give a seller and a buyer's agent a deep, recent set of comps to settle a price on quickly rather than argue over for months. And the buyer pool is deep: proven, repeated demand from owner-occupiers and investors alike, so a listing is not waiting on one specific type of buyer to show up.
JVC's case is clearest. At AED 13,697 per sqm, the lowest entry price in this table, and a 6.9% gross yield, it draws both first-time buyers and yield-focused investors, which is why turnover is highest here. Business Bay adds a central location to the same dynamic, and its volume held up even as its price rose 6.9% year-on-year, the fastest of any community we track, proof that depth and price growth are not mutually exclusive. Dubai South, despite a smaller ticket size (median unit around AED 776,000) and 76% off-plan share, still generated over 2,000 registered sales in 2026, more active than its "still under construction" reputation implies, though at that off-plan share most of that volume is developer sales rather than resales of owned units.
The trophy-asset trade-off: Palm Jumeirah and Sobha Hartland
At the other end, Palm Jumeirah and Sobha Hartland recorded just 593 and 635 sales respectively in 2026, the two lowest counts in Dubai's tracked communities. This is not a sign of a weak or failing market. Palm Jumeirah's ready-resale price, AED 29,036 per sqm, is the highest of any community here, and it rose 5.3% year-on-year, the second-fastest gain we track after Business Bay. The Palm's stock is simply scarce and expensive: a limited supply of trophy waterfront units, held by owners who are not forced sellers, changes hands far less often than a mid-market apartment tower.
The practical consequence is a longer, more selective sales process. Fewer transactions mean fewer recent comps to benchmark a listing against, so pricing a Palm Jumeirah unit correctly takes more judgment, and finding the specific buyer willing to pay top price for that specific unit can take considerably longer than an average marketing period. That is a reasonable trade for scarcity and long-run capital preservation, provided you go in expecting it.
Sobha Hartland is the harder case. It shares Palm Jumeirah's thin volume (635 sales) but not its price momentum: Sobha Hartland's ready-resale price fell 4.2% year-on-year, the steepest decline of any community in our data. Low turnover combined with a softening price is the least comfortable liquidity profile on this list, fewer buyers showing up, and the ones who do negotiating from a position of strength. An owner needing to exit Sobha Hartland soon should expect both a longer search for a buyer and downward pressure on the asking price.
Off-plan share: tomorrow's competition for your listing
Off-plan share measures how much of a community's current deal flow is still under-construction sales rather than completed resales. It matters for exit planning for a reason separate from today's liquidity: every off-plan unit sold today is a future resale listing once it hands over, competing with yours.
The volume figures below repeat the same total 2026 YTD transaction counts from the ranking table above, not an isolated resale count, since DLD's public dataset does not break sales down by off-plan versus secondary at the transaction level. That matters for how to read the ranking table: in communities where off-plan share is high, most of that total is developer sales, not owner resales, so today's true resale liquidity there is lower than the headline count implies.
| Community | Off-plan share | 2026 YTD sales |
|---|---|---|
| Meydan | 93% | 1,534 |
| JVT | 83% | 1,791 |
| JLT | 80% | 1,554 |
| Dubai South | 76% | 2,182 |
| Dubai Creek Harbour | 70% | 2,242 |
| Dubai Hills Estate | 62% | 1,199 |
| Dubai Sports City | 63% | 1,509 |
| Town Square | 54% | 1,160 |
| Al Furjan | 52% | 939 |
| JVC | 51% | 5,583 |
| Business Bay | 50% | 2,829 |
| DAMAC Hills | 42% | 799 |
| Palm Jumeirah | 39% | 593 |
| Downtown Dubai | 32% | 1,048 |
| Dubai Marina | 22% | 1,762 |
| Sobha Hartland | 20% | 635 |
Meydan, JVT, JLT, Dubai South and Dubai Creek Harbour all show off-plan shares above 70%, meaning most current activity there is still developer sales, not resales. In practical terms, that means most of the sales volume behind those five communities' position in the ranking table above is developer off-plan activity rather than people reselling an owned unit, so their place in that ranking overstates how liquid the secondary resale market for existing owners actually is today. That is not automatically bad news for existing owners; it usually reflects genuine, growing demand. But it does mean a wave of newly completed units will enter the resale pool over the next few years, adding to the listings a future seller there will be competing against. By contrast, Sobha Hartland (20%), Dubai Marina (22%), Downtown Dubai (32%) and Palm Jumeirah (39%) already sit mostly in mature, resale-dominated territory, so the competitive landscape a seller faces there is closer to what it looks like today.
The honest read is not "low off-plan share good, high off-plan share bad." A heavy pipeline raises the bar: demand has to keep growing at least as fast as supply for prices and absorption to hold, and a buyer entering a 70-90% off-plan-share community today should plan their own eventual exit assuming meaningfully more competing inventory than exists right now.
Cash buyers close faster: the deal mix behind the numbers
A related liquidity signal sits in how Dubai deals get funded. Across dld_transactions, roughly 81% of registered sales are outright cash purchases and only about 14% involve a mortgage registration. A cash-heavy market closes faster once a price is agreed, since there is no mortgage valuation, bank approval or financing contingency to clear before a deal registers at the trustee office. That does not change how long it takes to find a buyer in a low-volume community like Palm Jumeirah or Sobha Hartland, but once a buyer is found anywhere in Dubai, the path from signed agreement to registered transfer tends to be short.
Matching your holding period to the community you choose
None of this changes the DLD's transfer mechanics: the 4% DLD registration fee applies to every sale, and in practice it is the buyer who pays it. What changes is how confidently you can plan around a specific exit date. If your holding period is short or uncertain, JVC, Business Bay and Dubai Marina, combining meaningful volume with either strong or stable price direction, give you the widest, fastest-moving buyer pool to sell into. If you are buying for long-term capital preservation and can tolerate an open-ended exit window, Palm Jumeirah's thin but appreciating market is a reasonable trade. What this data argues against is treating a low-volume, price-softening community like Sobha Hartland as a short-term flip: that combination is where "I'll sell it in a year or two" is most likely to run into a longer, harder sale than the brochure implied. Our guides on the full cost stack of selling in Dubai and building a portfolio go further into planning an exit before it becomes urgent.
FAQ
Which Dubai community is easiest to sell in 2026? By 2026 YTD transaction volume, JVC (5,583 sales) and Business Bay (2,829) are the deepest, most liquid resale markets in Propick's DLD-based dataset: both sit close to a 50% off-plan share, so roughly half of that volume is existing owners reselling. Dubai Creek Harbour (2,242 sales) ranks third by total volume, but with a 70% off-plan share most of that count is developer sales rather than resales, so its actual secondary-market liquidity is more moderate than its raw rank suggests.
Does a high off-plan share mean prices will fall in that community? Not directly. It means a larger share of current deal flow is new developer sales rather than resales, so more completed units will enter the resale pool over the next few years. Whether that pressures prices depends on whether demand keeps pace with that pipeline, which off-plan share alone does not tell you.
Is Palm Jumeirah a bad investment because it has the lowest transaction volume? No. Palm Jumeirah's low volume (593 sales in 2026) reflects scarce, expensive trophy stock, not weak demand; its price rose 5.3% year-on-year, the second-fastest gain in our data. It simply means a sale there typically takes longer and depends more on finding the specific right buyer than a high-volume community does.
How is transaction volume different from "days on market"? Transaction volume counts completed, registered sales in a community over a period; it is a proxy for market depth and buyer-pool size, not a direct measure of how many days an individual listing sits before selling. A deep market with high volume generally supports a shorter, more predictable marketing period, but volume itself is not a days-on-market figure.
Who pays the DLD transfer fee when I sell? The DLD registration fee is 4% of the transaction value, and in practice it is the buyer who pays it, regardless of which community the sale is in.
Should I avoid low-volume communities entirely? Not necessarily. Low volume is a genuine trade-off for scarcity and prestige in a market like Palm Jumeirah, where price has still risen. It becomes a real warning sign specifically when it is paired with a falling price, as in Sobha Hartland's case, which is the combination this data flags as the hardest to exit at short notice.
Sources
- Dubai Land Department / DLD Open Data, dld_transactions (open dataset, full pagination, 2026 YTD transaction counts by community): https://dubailand.gov.ae/en/open-data/real-estate-data/
- Dubai Land Department / DLD Open Data, dld_rent_contracts (open dataset, used for gross yield figures cited): https://dubailand.gov.ae/en/open-data/real-estate-data/
- Dubai Land Department, Property Sale Registration e-service (4% transfer fee): https://dubailand.gov.ae/en/eservices/property-sale-registration/
- Dubai Land Department, Open Data portal: https://dubailand.gov.ae/en/open-data/real-estate-data/